

Question: 1. Please Explain what happened in each graph under deer, food, and predators Deer 60000 40000 deer 20000 1900 1910 1920 1930 1940 1950 Time
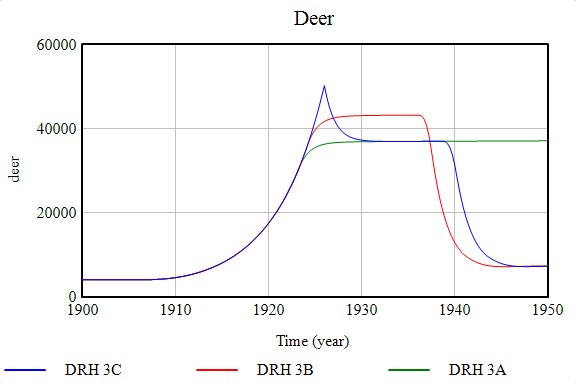
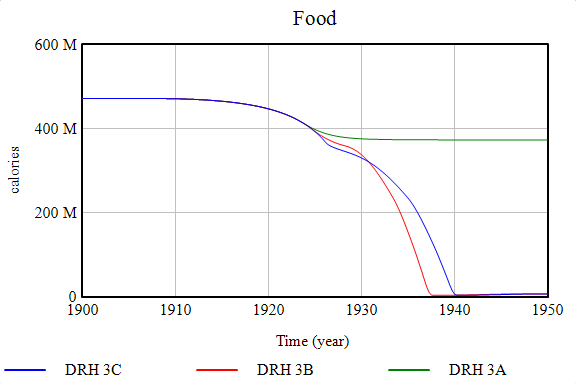
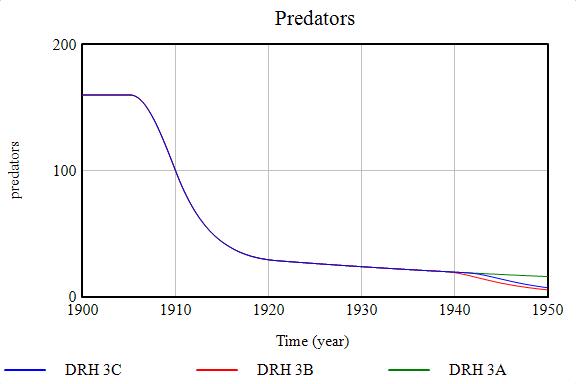
1. Please Explain what happened in each graph under deer, food, and predators
Deer 60000 40000 deer 20000 1900 1910 1920 1930 1940 1950 Time (year) DRH 3B DRH 3C DRH 3A Food 600 M 400 M calories 200 M 1900 1910 1920 1930 1940 1950 Time (year) DRH 3B DRH 3C DRH 3A Predators 200 predators 100 1900 1910 1920 1930 1940 1950 Time (year) DRH 3B DRH 3C DRH 3AStep by Step Solution
There are 3 Steps involved in it
1 Expert Approved Answer
Step: 1 Unlock

Question Has Been Solved by an Expert!
Get step-by-step solutions from verified subject matter experts
Step: 2 Unlock
Step: 3 Unlock