Question: 12 ADDENDUM: ASSIGNMENTS ASSIGNMENT 1 QUESTION 1 (8) 1.1 Customer satisfaction and loyalty is achieved through two dimensions, those of features, and freedom from deficiencies.
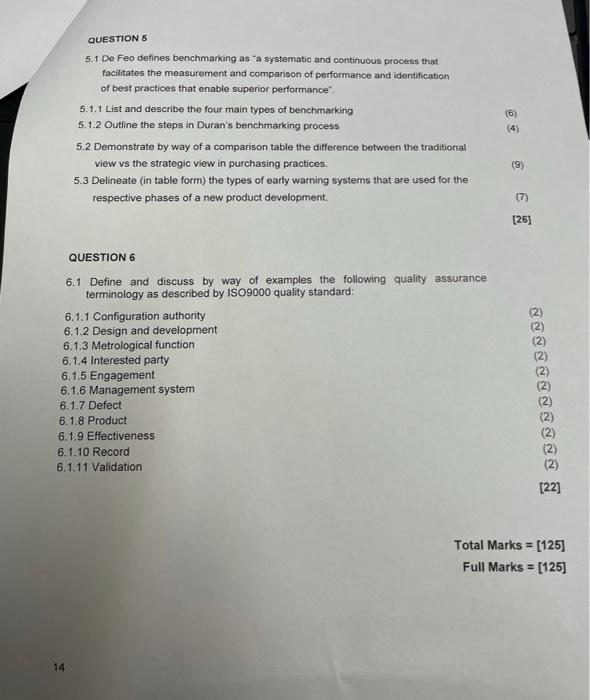
12 ADDENDUM: ASSIGNMENTS ASSIGNMENT 1 QUESTION 1 (8) 1.1 Customer satisfaction and loyalty is achieved through two dimensions, those of features, and freedom from deficiencies. Draw a table to illustrate the main categories of the two dimensions of quality for both manufacturing and service industries 1.2 The three universal processes for managing quality, also known as Juran's Trilogy, are Planning (design), Control (compliance), and improvement (breakthrough). Draw a table to clearly compare and differentiate the various elements within each quality process. (10) (18) QUESTION 2 2.1 For each 628 units of product manufactured, a certain process yields 588 conforming units, 22 are scrapped, and 18 that must be reprocessed. Each unit scrapped results in a R1,025 loss and each reprocessed unit requires 0.35 hours of extra processing time, where an hour of processing time costs R252.56 per unit. The resource time of producing the original 628 units is 18 hours. Use the given information to calculate the following: 2.1.1 The scrap cost 2.1.2 The reprocessing time 2.1.3 The reprocessing cost 2.1.4 The productivity per hour without reprocessing 2.1.5 The productivity per hour with reprocessing eeeee 2.1.2 A recently formed Kaizen department has instated a systemic production improvement project that has resulted in some production improvements. For 11 each 628 units manufactured, the process now yields 610 conforming units, o to be scrapped, and 12 for reprocessing Calculate the following 2.1.2.1 The scrap cost 2.1 2.2 The reprocessing time 2.1.2.3 The reprocessing cost 2.1.2.4 The productivity per hour without reprocessing 2.1.2.5 The productivity per hour with reprocessing 2.1.2.6 The benefits of the Kaizen project to each of the following quality measures: scrap cost, reprocessing time, reprocessing cost, productivity without reprocessing, and productivity with reprocessing to costs, to delivery schedules, and to productivity. eeeee (5) [15] QUESTION 3 3.1 You are the head quality engineer at a mechanical fasteners manufacturing company and the Safety, Health, Environment, and Quality (SHEQ) department manager has tasked you with compiling a Quality Cost Summary (QCS) for the company for the previous month. Use the following preliminary data to compile your QCS report The quality control department comprises eight inspectors who are primarily responsible for final inspections. There is one additional patrol inspector who performs first-off inspections on each production run. A quality inspector earns R24000 per month Production has two sorting inspectors, each earning R18000/month, who sort lots rejected by final inspection. The engineering department is responsible for, among other tasks. product and process failures analysis, as well as control plan generation which cost roughly R20000/month. An additional R16000/month is spent on previewing customer drawing specifications and deriving quality 12 requirements from them in order to establish quality specifications for U by manufacturing personnel. Scrap from final inspection rejection and customer returns amounted to 219000 and 333500 pieces, respectively, for the past month. Customer returns requiring rework average about 100000 pieces per month. Scrap generated during production is believed to be about half of the total floor scrap of 30000Kg/month. Final inspection rejects an average of 400000 re-workable pieces per month which are then flat rolled or re-rolled. Finance has costed scrap items at R12 per thousand pieces, floor scrap at R800 per thousand kilograms, reworking of customer returns at R4 per thousand pieces, and flat rolling and re-rolling at R1.20 per thousand pieces (19) (19) QUESTION 4 4.1 A failure mode and effect analysis was performed on ventilation machines that will be produced for the African market by a Chinese conglomerate. The analysis resulted in the identification of failure modes as detailed in the below table. Failure mode Insufficient Oxygen Severity Detection 10 1 8 Oxygen seepage Oxygen degradation Pathogenic transfer Overheating Occurrence Potential effects 6 Potential death to user 6 Inability to use 8 Reduced utility 9 Injuries to user 7 Injuries to user 6 7 3 A CNN (5) Determine the following: 4.1.1 Calculate the Risk Priority Number (RPN) for each failure mode. 4.1.2 Determine which four failure modes are the most important to analyse and develop (in table form) a control plan for each. (20) [25] 13 QUESTION 5 5.1 De Feo defines benchmarking as a systematic and continuous process that facilitates the measurement and comparison of performance and Identification of best practices that enable superior performance 5.1.1 List and describe the four main types of benchmarking 5.1.2 Outline the steps in Duran's benchmarking process 5.2 Demonstrate by way of a comparison table the difference between the traditional view vs the strategic view in purchasing practices. 5.3 Delineate (in table form) the types of early warning systems that are used for the respective phases of a new product development. (6) (4) (9) (7) [26] QUESTION 6 6.1 Define and discuss by way of examples the following quality assurance terminology as described by ISO9000 quality standard: 6.1.1 Configuration authority 6.1.2 Design and development 6.1.3 Metrological function 6.1.4 Interested party 6.1.5 Engagement 6.1.6 Management system 6.1.7 Defect 6.1.8 Product 6.1.9 Effectiveness 6.1.10 Record 6.1.11 Validation aaaaaaaaaaaa Total Marks = [125] Full Marks = [126] 14