

Question: 1.Draw and plot R chart. 2.Is the process in control? Please explain. note: i need to answers (1&2) Table 1 begin{tabular}{|c|c|c|} hline HOUR & x
1.Draw and plot R chart.
2.Is the process in control? Please explain.
note: i need to answers (1&2)
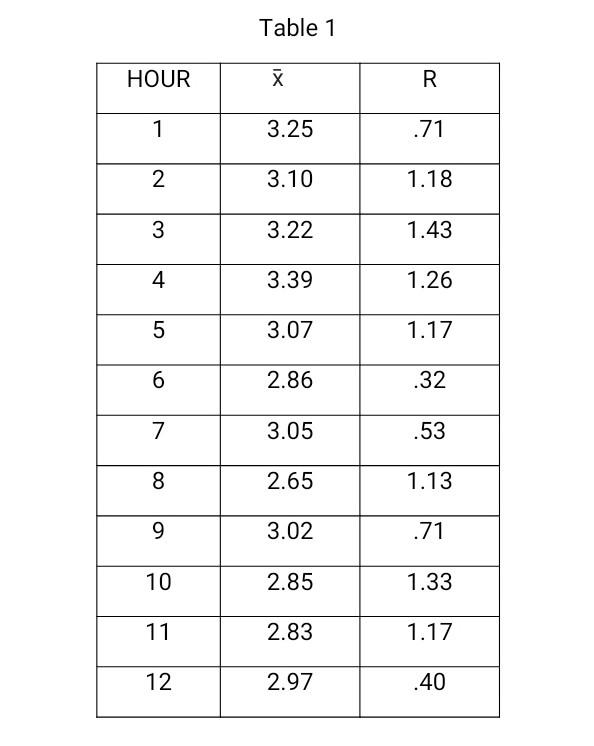
Table 1 \begin{tabular}{|c|c|c|} \hline HOUR & x & R \\ \hline 1 & 3.25 & .71 \\ \hline 2 & 3.10 & 1.18 \\ \hline 3 & 3.22 & 1.43 \\ \hline 4 & 3.39 & 1.26 \\ \hline 5 & 3.07 & 1.17 \\ \hline 6 & 2.86 & .32 \\ \hline 7 & 3.05 & .53 \\ \hline 8 & 2.65 & 1.13 \\ \hline 9 & 3.02 & .71 \\ \hline 10 & 2.85 & 1.33 \\ \hline 11 & 2.83 & 1.17 \\ \hline 12 & 2.97 & .40 \\ \hline \end{tabular} Table 1 \begin{tabular}{|c|c|c|} \hline HOUR & x & R \\ \hline 1 & 3.25 & .71 \\ \hline 2 & 3.10 & 1.18 \\ \hline 3 & 3.22 & 1.43 \\ \hline 4 & 3.39 & 1.26 \\ \hline 5 & 3.07 & 1.17 \\ \hline 6 & 2.86 & .32 \\ \hline 7 & 3.05 & .53 \\ \hline 8 & 2.65 & 1.13 \\ \hline 9 & 3.02 & .71 \\ \hline 10 & 2.85 & 1.33 \\ \hline 11 & 2.83 & 1.17 \\ \hline 12 & 2.97 & .40 \\ \hline \end{tabular}Step by Step Solution
There are 3 Steps involved in it
1 Expert Approved Answer
Step: 1 Unlock

Question Has Been Solved by an Expert!
Get step-by-step solutions from verified subject matter experts
Step: 2 Unlock
Step: 3 Unlock