

Question: please answer all 6 parts. please explain & number all 6 answers thank you. West Battery Corp. has recently been receiving complaints from retailers that
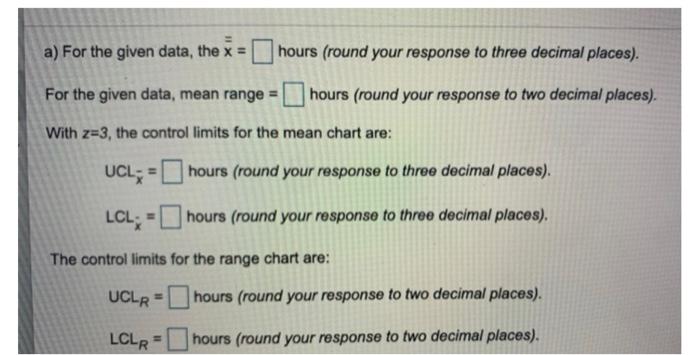
please answer all 6 parts. please explain & number all 6 answers thank you. 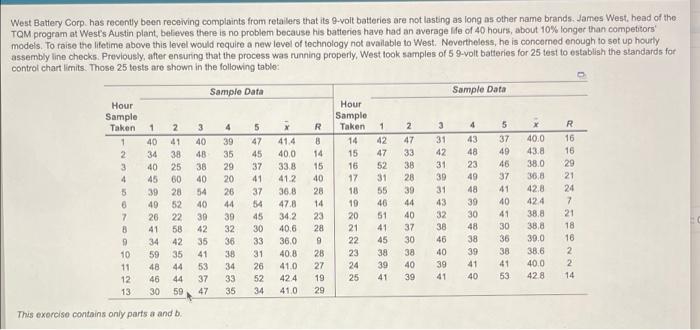

Step by Step Solution
There are 3 Steps involved in it
1 Expert Approved Answer
Step: 1 Unlock

Question Has Been Solved by an Expert!
Get step-by-step solutions from verified subject matter experts
Step: 2 Unlock
Step: 3 Unlock