

Question: 2. Consider Table 1 . (a) Consider Table 1. Using the single index model, calculate alpha, beta, and the expected return for stock 1 and
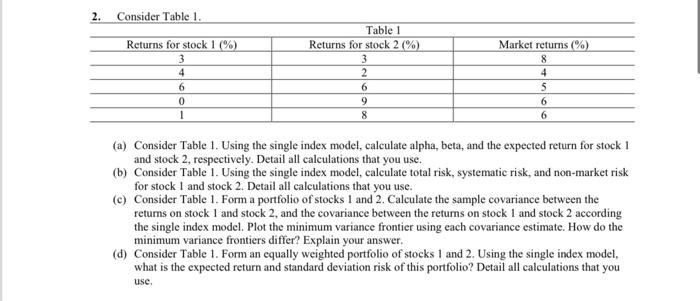
2. Consider Table 1 . (a) Consider Table 1. Using the single index model, calculate alpha, beta, and the expected return for stock 1 and stock 2, respectively. Detail all calculations that you use. (b) Consider Table 1. Using the single index model, calculate total risk, systematic risk, and non-market risk for stock 1 and stock 2 . Detail all calculations that you use. (c) Consider Table 1. Form a portfolio of stocks 1 and 2 . Calculate the sample covariance between the retums on stock 1 and stock 2 , and the covariance between the returns on stock 1 and stock 2 according the single index model. Plot the minimum variance frontier using each covariance estimate. How do the minimum variance frontiers differ? Explain your answer. (d) Consider Table 1. Form an equally weighted portfolio of stocks 1 and 2 . Using the single index model, what is the expected return and standard deviation risk of this portfolio? Detail all calculations that you use
Step by Step Solution
There are 3 Steps involved in it

Get step-by-step solutions from verified subject matter experts