

Question: 2. Does the model yield logical estimates with respect to intrinsic value and time-to-maturity? What happens to the option premiums as you change the volatility?
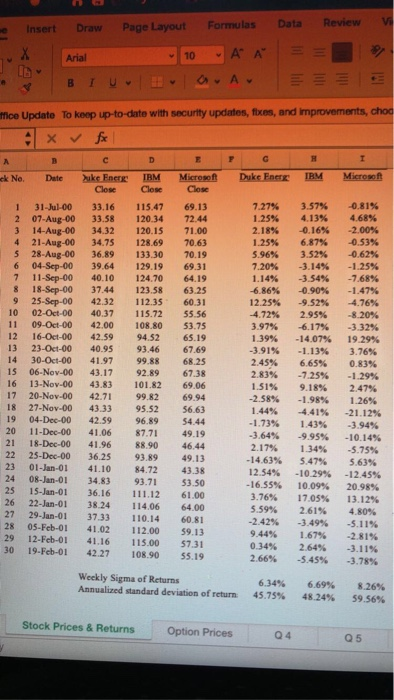
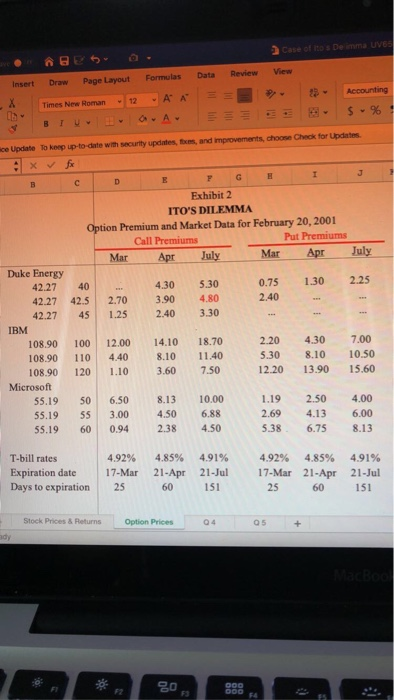
Insert Draw Page Layout Formulas Data Review Arial 10 A A BIU a Av fice Update To keep up-to-date with security updates, fixes, and improvements, chod 4 x D E G H I ck No. Date Duke Energ IBM Microsoft Duke Ener Close IBM Close 1 31-Jul-00 2 07-Aug-00 3 14-Aug-00 4 21-Aug-00 5 28-Aug-00 6 04-Sep-00 7 11-Sep-00 8 18-Sep-00 9 25-Sep-00 10 02-Oct-00 11 09-Oct-00 12 16-Oct-00 13 23-Oct-00 14 30-Oct-00 15 06-Nov-00 16 13-Nov-00 17 20-Nov-00 18 27-Nov.00 19 04-Dec-00 20 11-Dec-00 21 18-Dec-00 22 25-Dec-00 23 01-Jan-01 24 08-Jan-01 25 15-Jan-01 26 22-Jan-01 27 29-Jan-01 28 05-Feb-01 29 12-Feb-01 30 19-Feb-01 33.16 33.58 34.32 34.75 36.89 39.64 40.10 37.44 42.32 40.37 42.00 42.59 40.95 41.97 43.17 43.83 42.71 43.33 42.59 41.06 41.96 36.25 41.10 34.83 36.16 38.24 37.33 41.02 41.16 42.27 115.47 120.34 120.15 128.69 133.30 129.19 124.70 123.58 112.35 115.72 108.80 94.52 93.46 99.88 92.89 101.82 99.82 95.52 96.89 87.71 88.90 93.89 84.72 93.71 111.12 114.06 110.14 112.00 115.00 108.90 Microsoft Close 69.13 72.44 71.00 70.63 70.19 69.31 64.19 63.25 60.31 55.56 53.75 65.19 67.69 68.25 67.38 69.06 69.94 56.63 54.44 49.19 46.44 49.13 43.38 53.50 61.00 64.00 60.81 59.13 57.31 55.19 7.279 1.25% 2.18% 1.25% 5.96% 7.20% 1.14% -6.86% 12.25% -4.72% 3.97% 1.39% -3.91% 2.45% 2.83% 1.51% -2.58% 1.44% -1.73% -3.64% 2.17% -14.63% 12.54% -16.55% 3.76% 5.59% -2.42% 9.44% 0.34% 2.66% 3.57% 4.13% -0.16% 6.87% 3.52% -3.14% -3.54% -0.90% -9.52% 2.95% -6.17% -14.07% -1.13% 6.65% -7.25% 9.18% -1.98% -0.81% 4.68% -2.00% -0.53% -0.62% -1.25% -7.68% -1.47% -4.76% -8.20% -3.32% 19.29% 3.76% 0.83% -1.29% 2.47% 1.26% -21.12% -3.94% -10.14% -5.75% 5.63% -12.45% 20.98% 13.12% 4.80% -5.11% -2.81% 1.43% -9.95% 1.34% 5.47% - 10.29% 10.09% 17.05% 2.61% -3.49% 1.67% 2.64% -5.45% -3.78% Weekly Sigma of Returns Annualized standard deviation of return 6.34% 45.75% 6.69% 48.24% 8.26% 59.56% Stock Prices & Returns Option Prices Q4 Q5 Case of hos De imma uves Data Review View Formulas Insert Draw Page Layout Accounting 12 -A A X ub Times New Roman $ % BIU ce Update To keep up-to-date with security updates, fixes, and improvements, choose Check for Updates x x 2 F D E G H I Exhibit 2 ITO'S DILEMMA Option Premium and Market Data for February 20, 2001 Call Premiums Put Premiums Mar Apr July Mar Apr July 1.30 2.25 40 425 45 4.30 3.90 2.40 2.70 1.25 5.30 4.80 3.30 0.75 2.40 Duke Energy 42.27 42.27 42.27 IBM 108.90 108.90 108.90 Microsoft 55.19 55.19 55.19 100 110 120 12.00 4.40 1.10 14.10 8.10 3.60 18.70 11.40 7.50 2.20 5.30 12.20 4.30 8.10 13.90 7.00 10.50 15.60 50 55 60 6.50 3.00 0.94 8.13 4.50 2.38 10.00 6.88 4.50 1.19 2.69 5.38 2.50 4.13 6.75 4.00 6.00 8.13 T-bill rates Expiration date Days to expiration 4.92% 17-Mar 25 4.85% 21 - Apr 60 4.91% 21-Jul 151 4.92% 4.85% 17-Mar 21-Apr 25 60 4.91% 21-Jul 151 Stock Prices & Returns Option Prices 04 05 + FI 000 80 F3 F2 DOO F Insert Draw Page Layout Formulas Data Review Arial 10 A A BIU a Av fice Update To keep up-to-date with security updates, fixes, and improvements, chod 4 x D E G H I ck No. Date Duke Energ IBM Microsoft Duke Ener Close IBM Close 1 31-Jul-00 2 07-Aug-00 3 14-Aug-00 4 21-Aug-00 5 28-Aug-00 6 04-Sep-00 7 11-Sep-00 8 18-Sep-00 9 25-Sep-00 10 02-Oct-00 11 09-Oct-00 12 16-Oct-00 13 23-Oct-00 14 30-Oct-00 15 06-Nov-00 16 13-Nov-00 17 20-Nov-00 18 27-Nov.00 19 04-Dec-00 20 11-Dec-00 21 18-Dec-00 22 25-Dec-00 23 01-Jan-01 24 08-Jan-01 25 15-Jan-01 26 22-Jan-01 27 29-Jan-01 28 05-Feb-01 29 12-Feb-01 30 19-Feb-01 33.16 33.58 34.32 34.75 36.89 39.64 40.10 37.44 42.32 40.37 42.00 42.59 40.95 41.97 43.17 43.83 42.71 43.33 42.59 41.06 41.96 36.25 41.10 34.83 36.16 38.24 37.33 41.02 41.16 42.27 115.47 120.34 120.15 128.69 133.30 129.19 124.70 123.58 112.35 115.72 108.80 94.52 93.46 99.88 92.89 101.82 99.82 95.52 96.89 87.71 88.90 93.89 84.72 93.71 111.12 114.06 110.14 112.00 115.00 108.90 Microsoft Close 69.13 72.44 71.00 70.63 70.19 69.31 64.19 63.25 60.31 55.56 53.75 65.19 67.69 68.25 67.38 69.06 69.94 56.63 54.44 49.19 46.44 49.13 43.38 53.50 61.00 64.00 60.81 59.13 57.31 55.19 7.279 1.25% 2.18% 1.25% 5.96% 7.20% 1.14% -6.86% 12.25% -4.72% 3.97% 1.39% -3.91% 2.45% 2.83% 1.51% -2.58% 1.44% -1.73% -3.64% 2.17% -14.63% 12.54% -16.55% 3.76% 5.59% -2.42% 9.44% 0.34% 2.66% 3.57% 4.13% -0.16% 6.87% 3.52% -3.14% -3.54% -0.90% -9.52% 2.95% -6.17% -14.07% -1.13% 6.65% -7.25% 9.18% -1.98% -0.81% 4.68% -2.00% -0.53% -0.62% -1.25% -7.68% -1.47% -4.76% -8.20% -3.32% 19.29% 3.76% 0.83% -1.29% 2.47% 1.26% -21.12% -3.94% -10.14% -5.75% 5.63% -12.45% 20.98% 13.12% 4.80% -5.11% -2.81% 1.43% -9.95% 1.34% 5.47% - 10.29% 10.09% 17.05% 2.61% -3.49% 1.67% 2.64% -5.45% -3.78% Weekly Sigma of Returns Annualized standard deviation of return 6.34% 45.75% 6.69% 48.24% 8.26% 59.56% Stock Prices & Returns Option Prices Q4 Q5 Case of hos De imma uves Data Review View Formulas Insert Draw Page Layout Accounting 12 -A A X ub Times New Roman $ % BIU ce Update To keep up-to-date with security updates, fixes, and improvements, choose Check for Updates x x 2 F D E G H I Exhibit 2 ITO'S DILEMMA Option Premium and Market Data for February 20, 2001 Call Premiums Put Premiums Mar Apr July Mar Apr July 1.30 2.25 40 425 45 4.30 3.90 2.40 2.70 1.25 5.30 4.80 3.30 0.75 2.40 Duke Energy 42.27 42.27 42.27 IBM 108.90 108.90 108.90 Microsoft 55.19 55.19 55.19 100 110 120 12.00 4.40 1.10 14.10 8.10 3.60 18.70 11.40 7.50 2.20 5.30 12.20 4.30 8.10 13.90 7.00 10.50 15.60 50 55 60 6.50 3.00 0.94 8.13 4.50 2.38 10.00 6.88 4.50 1.19 2.69 5.38 2.50 4.13 6.75 4.00 6.00 8.13 T-bill rates Expiration date Days to expiration 4.92% 17-Mar 25 4.85% 21 - Apr 60 4.91% 21-Jul 151 4.92% 4.85% 17-Mar 21-Apr 25 60 4.91% 21-Jul 151 Stock Prices & Returns Option Prices 04 05 + FI 000 80 F3 F2 DOO F
Step by Step Solution
There are 3 Steps involved in it

Get step-by-step solutions from verified subject matter experts