

Question: Does the model yield logical estimates with respect to intrinsic value and time-tomaturity? What happens to the option premiums as you change the volatility? Can
Does the model yield logical estimates with respect to intrinsic value and time-tomaturity? What happens to the option premiums as you change the volatility? Can you explain why volatility affects prices in such a manner?
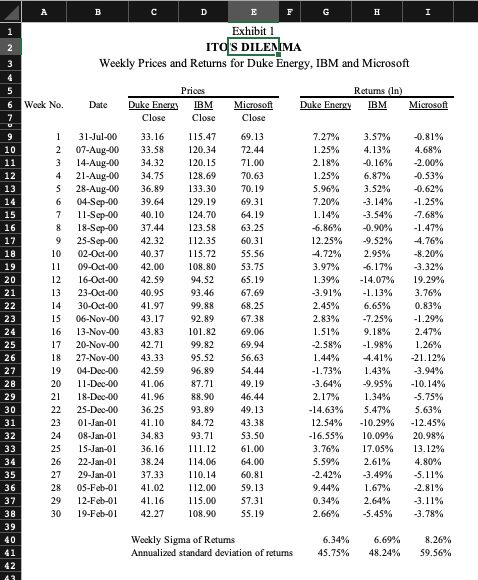
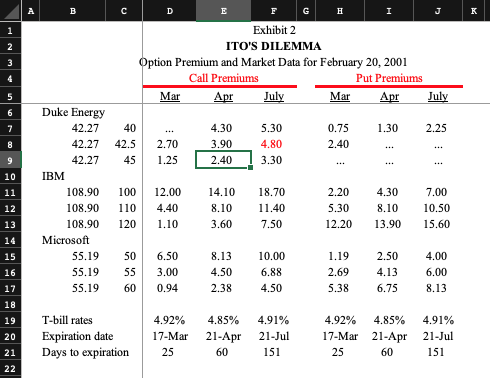
Exhibit 1 ITOS DILENIMA Weekly Prices and Returns for Duke Energy, IBM and Microsoft Returns (In) Duke Energy IBM Microsoft 20 -0.81% 4.68% -2.00% -0.53% Prices 6 Week No. Date Duke Energy IBM Microsoft Close Close Close 1 31-Jul-00 3 3.16 115.47 69.13 2 07-Aug-00 33.58 120.34 72.44 3 14-Aug-00 34.32 120.15 71.00 4 21-Aug-003 4.75 128.69 70.63 5 28-Aug-00 36.89 133.30 70.19 6 04-Sep-00 39.64 129.19 69.31 7 11-Sep-00 40.10 124.70 64.19 18-Sep-00 37.44 123.58 63.25 9 25-Sep-00 42.32 112.35 60.31 10 02-Oct-00 40.37 115.72 55.56 1109-Oct-00 42.00 108.80 53.75 12 16-Oct-00 42.59 94.52 65.19 13 23-Oct-00 40.95 93.46 67.69 14 30-Oct-00 41.97 99.88 68.25 15 06-Nov-00 43.17 92.89 67.38 16 13-Nov-00 4 3.83 101.82 69.06 17 20-Nov-00 42.71 99.82 69.94 18 27-Nov-00 43.33 95.52 56.63 1904-Dec-00 42.59 96.89 54.44 2011-Dec-0041.06 87.7149.19 21 18-Dec-00 41.96 88.90 46.44 25-Dec-00 36.25 93.89 49.13 01-Jan-01 41.10 84.72 43.38 08-Jan-01 3 4.83 93.71 53.50 25 15-Jan-01 36.16 1 11.12 61.00 26 22-Jan-01 3 8.24 114.06 64.00 27 29-Jan-01 37.33 110.14 60.81 28 05-Feb-01 41.02 112.00 59.13 12-Feb-01 41.16 115.00 57.31 30 19-Feb-01 4 2.27 108.90 55.19 7.27% 1.25% 2.18% 1.25% 5.96% 7.20% 1.14% 6.86% 12.25% 4.72% 3.97% 1.39% -3.91% 2.45% 2.83% 1.51% -2.58% 1.44% -1.73% -3.64% 2.17% -14.63% 12.54% -16.55% 3.76% 5.59% -2.42% 9.44% 0.34% 2.66% 3.57% 4.139 -0.16% 6.87% 3.52% -3.14% -3.54% -0.90% -9.52% 2.95% 6.17% -14.07% -1.13% 6.65% -7.25% 9.18% -1.98% 4.41% 1.43% -9.95% 1.34% 5.47% -10.29% 10.09% 17.05% 2.61% -3.49% 1.67% 2.64% -5.45% -1.25% -7.68% -1.47% 4.76% -8.20% -3.32% 19.29% 3.76% 0.83% -1.29% 2.47% 1.26% -21.12% -3.94% -10.14% -5.75% 5.63% -12.45% 20.98% 13.12% 4.80% -5.11% 2.81% -3.11% -3.78% 22 Weekly Sigma of Returns Annualized standard deviation of returns 6.34% 45.75% 6.69% 48.24% 8.26% 59.56% C D E Exhibit 2 ITO'S DILEMMA Option Premium and Market Data for February 20, 2001 Call Premiums Put Premiums Mar Apr July Mar Apr July Duke Energy 1.30 2.25 ... 2.70 1.25 4.30 5.30 3.90 4.80 2.40 13.30 0.75 2.40 10 42.27 42.5 42.27 45 IBM 108.90 100 108.90 110 108.90 120 Microsoft 55.19 50 55.19 55 55.1960 12.00 4.40 1.10 14.10 8.10 3.60 18.70 11.40 7.50 2.20 5.30 12.20 4.30 8.10 13.90 7.00 10.50 15.60 6.50 3.00 0.94 8.13 4.50 2.38 10.00 6.88 4.50 1.19 2.69 5.38 2.50 4.00 4.136.00 6.75 8.13 T-bill rates Expiration date Days to expiration 4.92% 17-Mar 25 4.85% 21-Apr 60 4.91% 21-Jul 151 4.92% 17-Mar 4.85% 21-Apr 60 4.91% 21-Jul 151 25 Exhibit 1 ITOS DILENIMA Weekly Prices and Returns for Duke Energy, IBM and Microsoft Returns (In) Duke Energy IBM Microsoft 20 -0.81% 4.68% -2.00% -0.53% Prices 6 Week No. Date Duke Energy IBM Microsoft Close Close Close 1 31-Jul-00 3 3.16 115.47 69.13 2 07-Aug-00 33.58 120.34 72.44 3 14-Aug-00 34.32 120.15 71.00 4 21-Aug-003 4.75 128.69 70.63 5 28-Aug-00 36.89 133.30 70.19 6 04-Sep-00 39.64 129.19 69.31 7 11-Sep-00 40.10 124.70 64.19 18-Sep-00 37.44 123.58 63.25 9 25-Sep-00 42.32 112.35 60.31 10 02-Oct-00 40.37 115.72 55.56 1109-Oct-00 42.00 108.80 53.75 12 16-Oct-00 42.59 94.52 65.19 13 23-Oct-00 40.95 93.46 67.69 14 30-Oct-00 41.97 99.88 68.25 15 06-Nov-00 43.17 92.89 67.38 16 13-Nov-00 4 3.83 101.82 69.06 17 20-Nov-00 42.71 99.82 69.94 18 27-Nov-00 43.33 95.52 56.63 1904-Dec-00 42.59 96.89 54.44 2011-Dec-0041.06 87.7149.19 21 18-Dec-00 41.96 88.90 46.44 25-Dec-00 36.25 93.89 49.13 01-Jan-01 41.10 84.72 43.38 08-Jan-01 3 4.83 93.71 53.50 25 15-Jan-01 36.16 1 11.12 61.00 26 22-Jan-01 3 8.24 114.06 64.00 27 29-Jan-01 37.33 110.14 60.81 28 05-Feb-01 41.02 112.00 59.13 12-Feb-01 41.16 115.00 57.31 30 19-Feb-01 4 2.27 108.90 55.19 7.27% 1.25% 2.18% 1.25% 5.96% 7.20% 1.14% 6.86% 12.25% 4.72% 3.97% 1.39% -3.91% 2.45% 2.83% 1.51% -2.58% 1.44% -1.73% -3.64% 2.17% -14.63% 12.54% -16.55% 3.76% 5.59% -2.42% 9.44% 0.34% 2.66% 3.57% 4.139 -0.16% 6.87% 3.52% -3.14% -3.54% -0.90% -9.52% 2.95% 6.17% -14.07% -1.13% 6.65% -7.25% 9.18% -1.98% 4.41% 1.43% -9.95% 1.34% 5.47% -10.29% 10.09% 17.05% 2.61% -3.49% 1.67% 2.64% -5.45% -1.25% -7.68% -1.47% 4.76% -8.20% -3.32% 19.29% 3.76% 0.83% -1.29% 2.47% 1.26% -21.12% -3.94% -10.14% -5.75% 5.63% -12.45% 20.98% 13.12% 4.80% -5.11% 2.81% -3.11% -3.78% 22 Weekly Sigma of Returns Annualized standard deviation of returns 6.34% 45.75% 6.69% 48.24% 8.26% 59.56% C D E Exhibit 2 ITO'S DILEMMA Option Premium and Market Data for February 20, 2001 Call Premiums Put Premiums Mar Apr July Mar Apr July Duke Energy 1.30 2.25 ... 2.70 1.25 4.30 5.30 3.90 4.80 2.40 13.30 0.75 2.40 10 42.27 42.5 42.27 45 IBM 108.90 100 108.90 110 108.90 120 Microsoft 55.19 50 55.19 55 55.1960 12.00 4.40 1.10 14.10 8.10 3.60 18.70 11.40 7.50 2.20 5.30 12.20 4.30 8.10 13.90 7.00 10.50 15.60 6.50 3.00 0.94 8.13 4.50 2.38 10.00 6.88 4.50 1.19 2.69 5.38 2.50 4.00 4.136.00 6.75 8.13 T-bill rates Expiration date Days to expiration 4.92% 17-Mar 25 4.85% 21-Apr 60 4.91% 21-Jul 151 4.92% 17-Mar 4.85% 21-Apr 60 4.91% 21-Jul 151 25
Step by Step Solution
There are 3 Steps involved in it

Get step-by-step solutions from verified subject matter experts