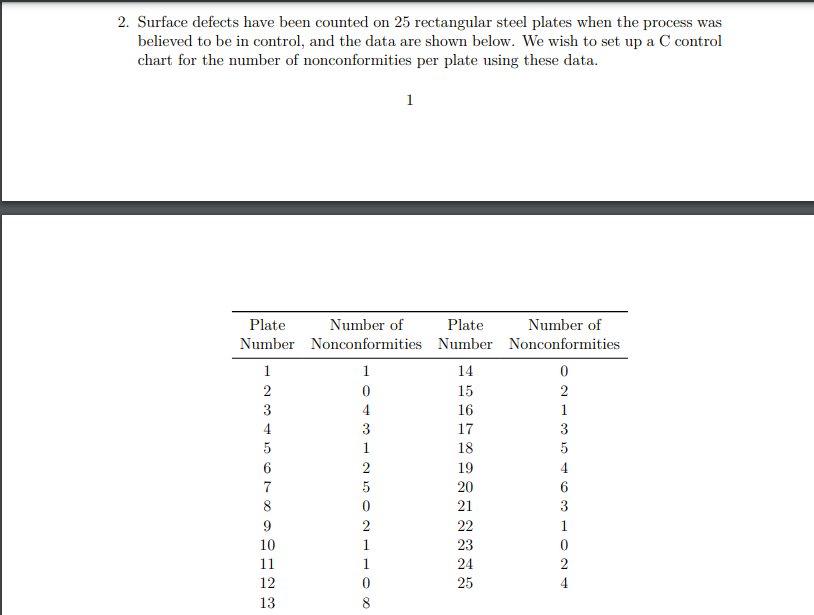
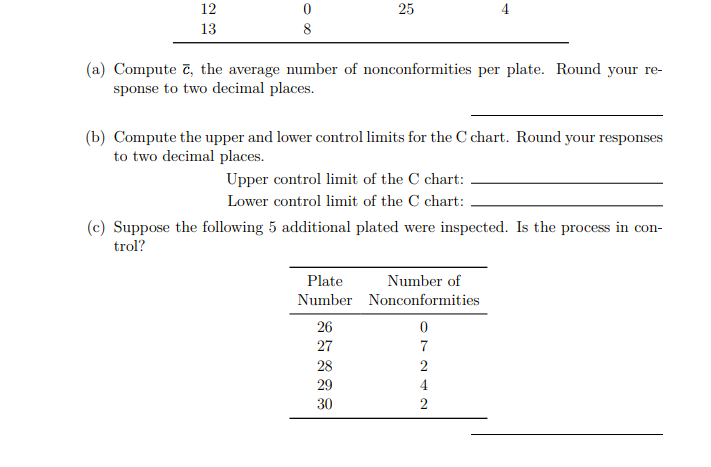
Question: 2. Surface defects have been counted on 25 rectangular steel plates when the process was believed to be in control, and the data are shown

2. Surface defects have been counted on 252. Surface defects have been counted on 25

2. Surface defects have been counted on 25 rectangular steel plates when the process was believed to be in control, and the data are shown below. We wish to set up a C control chart for the number of nonconformities per plate using these data. 1 Plate Number of Plate Number of Number Nonconformities Number Nonconformities 1 1 14 0 2 0 15 2 3 4 16 1 4 3 17 3 5 1 18 5 6 2 19 4 7 5 20 6 8 0 21 3 9 2 22 1 10 1 23 0 11 1 24 2 12 0 25 4 13 8 25 4 12 13 0 8 (a) Compute c, the average number of nonconformities per plate. Round your re- sponse to two decimal places. (b) Compute the upper and lower control limits for the chart. Round your responses to two decimal places. Upper control limit of the C chart: Lower control limit of the chart: (C) Suppose the following 5 additional plated were inspected. Is the process in con- trol? Plate Number of Number Nonconformities 26 0 7 28 2 29 4 30 2 27 NNO

Step by Step Solution

There are 3 Steps involved in it

1 Expert Approved Answer
Step: 1 Unlock blur-text-image
Question Has Been Solved by an Expert!

Get step-by-step solutions from verified subject matter experts

Step: 2 Unlock
Step: 3 Unlock

Students Have Also Explored These Related General Management Questions!