

Question: 2. The following table represents a plan for a project: a. Construct the appropriate network diagram. ( 10 points) b. What is the critical path?
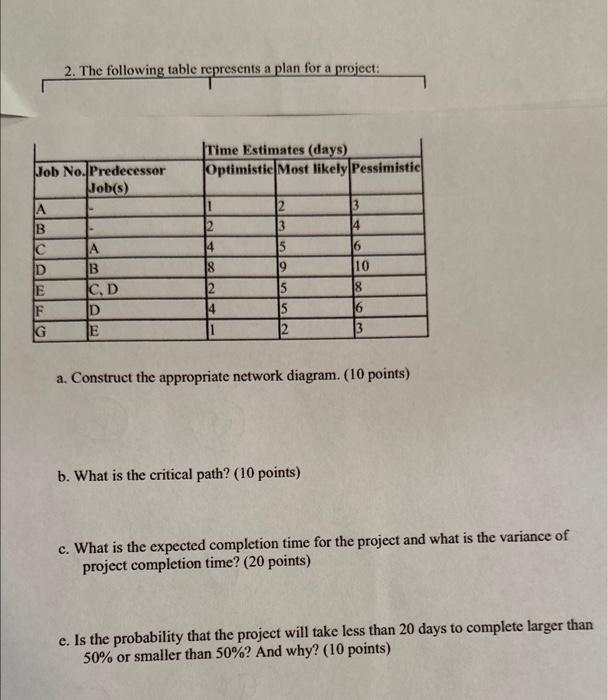
2. The following table represents a plan for a project: a. Construct the appropriate network diagram. ( 10 points) b. What is the critical path? ( 10 points) c. What is the expected completion time for the project and what is the variance of project completion time? ( 20 points) e. Is the probability that the project will take less than 20 days to complete larger than 50% or smaller than 50% ? And why? ( 10 points)
Step by Step Solution
There are 3 Steps involved in it
1 Expert Approved Answer
Step: 1 Unlock

Question Has Been Solved by an Expert!
Get step-by-step solutions from verified subject matter experts
Step: 2 Unlock
Step: 3 Unlock