

Question: 2. The scatterplot below shows the relationship between socoeconomic status measured as the peroentagr of children in a neighborhood receiving reduced lee lunches at school
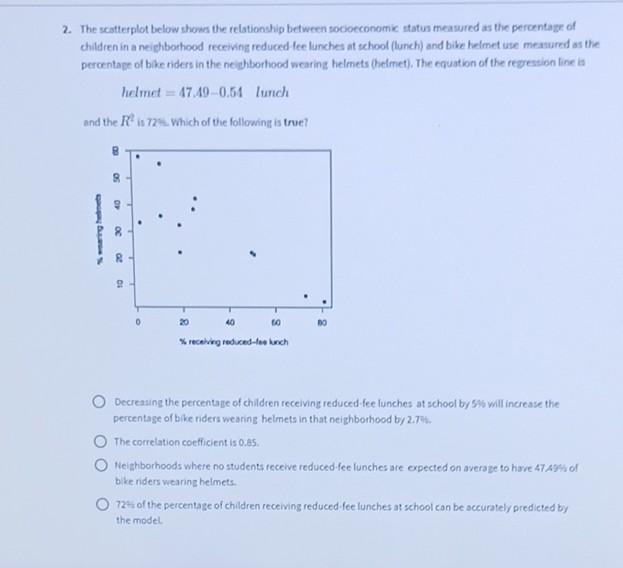
2. The scatterplot below shows the relationship between socoeconomic status measured as the peroentagr of children in a neighborhood receiving reduced lee lunches at school (lunch) and bike helmet use measured as the percentage of bike riders in the neighborhood wearing helmets (helmet). The equation of the regeseion line is helmet=47.490.51lunch and the R2 is 724 . Which of the following is true? Decreasing the percentage of children receiving reduced fee lunches at school by 5% will increase the percentage of bike riders wearing helmets in that neighborhood b/2.7\%. The correlation coefficient is 0.25. Neighborhoods where no students receive reduced-fee lunches are expected on averaze to have 47.49% of bke riders wearing helmets. 72ts of the percentage of children receiving reduced fee lunches at school can be accurately predieted by the model
Step by Step Solution
There are 3 Steps involved in it

Get step-by-step solutions from verified subject matter experts