

Question: 2.6 Establish control chart limits for X bar and R charts. Calculate the process capability and interpret the meaning of control chart. 2.6 Establish control
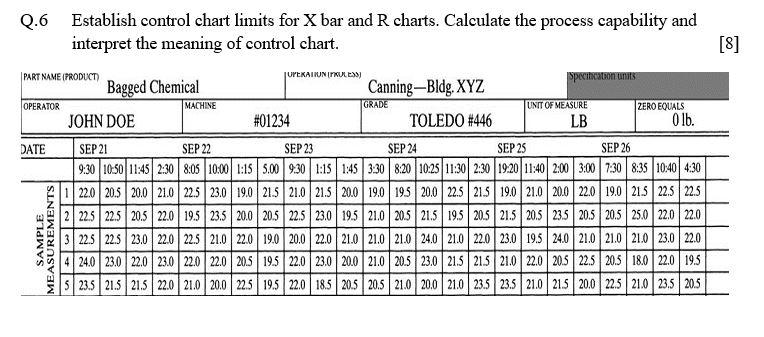
2.6 Establish control chart limits for X bar and R charts. Calculate the process capability and interpret the meaning of control chart. 2.6 Establish control chart limits for X bar and R charts. Calculate the process capability and interpret the meaning of control chart
Step by Step Solution
There are 3 Steps involved in it
1 Expert Approved Answer
Step: 1 Unlock

Question Has Been Solved by an Expert!
Get step-by-step solutions from verified subject matter experts
Step: 2 Unlock
Step: 3 Unlock