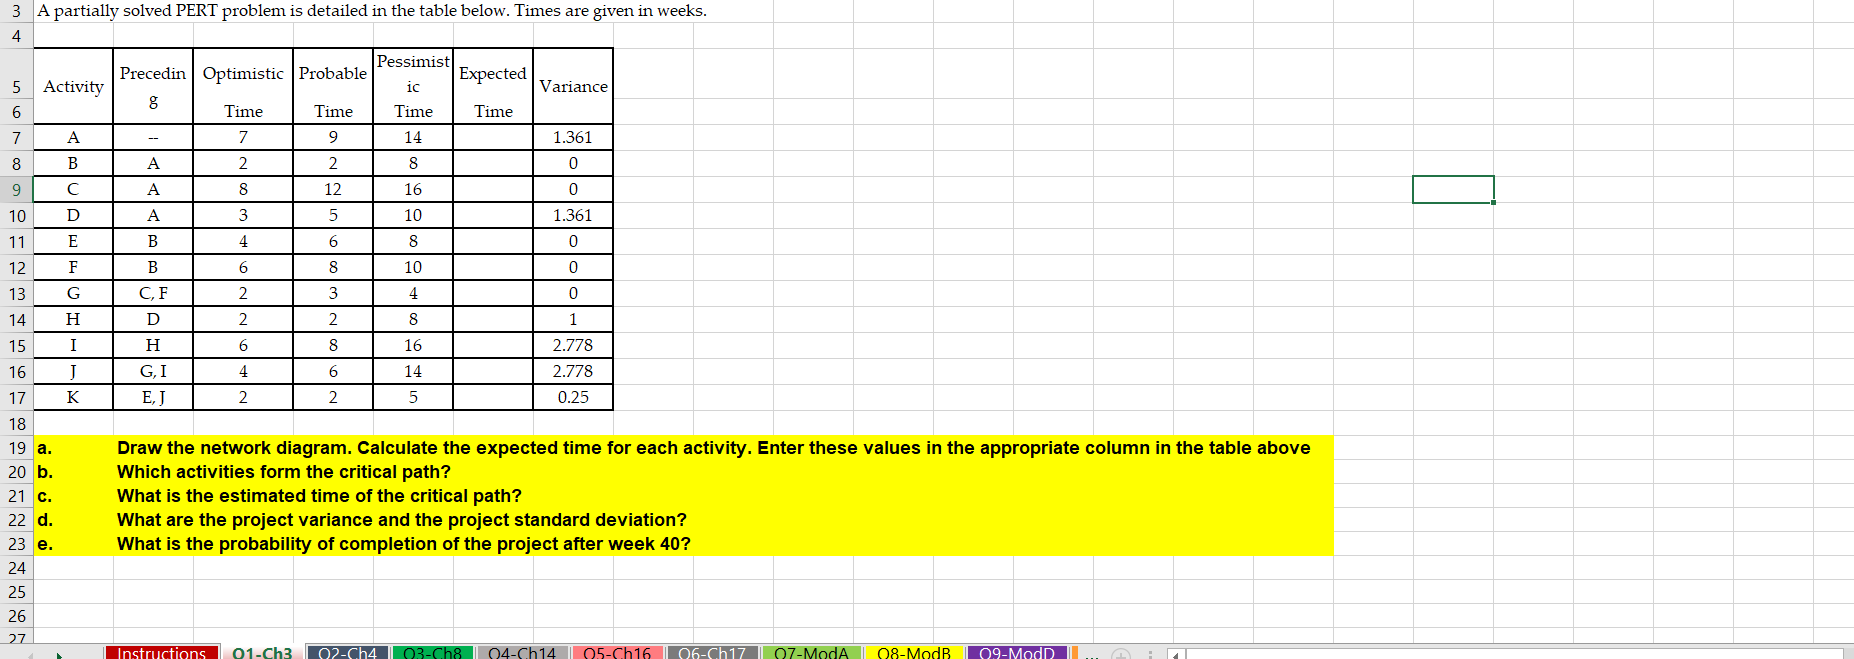
Question: 3 A partially solved PERT problem is detailed in the table below. Times are given in weeks. 4 5 Activity Variance Pessimist Precedin Optimistic Probable

3 A partially solved PERT problem is detailed in

3 A partially solved PERT problem is detailed in the table below. Times are given in weeks. 4 5 Activity Variance Pessimist Precedin Optimistic Probable Expected ic 8 Time Time Time Time 7 9 14 6 7 A B 1.361 0 8 A 2 2 8 9 8 12 16 0 10 5 10 1.361 D E F A B 3 4 11 6 8 0 12 B 6 8 10 0 13 G CF 3 4 0 2 2 D 8 1 14 15 2 8 6 16 H I J K 16 H GI E,J 4 6 14 2.778 2.778 0.25 17 2 2 5 18 19 a. 20 b. 21 c. Draw the network diagram. Calculate the expected time for each activity. Enter these values in the appropriate column in the table above Which activities form the critical path? What is the estimated time of the critical path? What are the project variance and the project standard deviation? What is the probability of completion of the project after week 40? 22 d. 23 e. 24 25 26 27 Instructions 01-Ch3 Q2-Ch4 03-Ch8 04-Ch 14 05-Ch 16 06-Ch17 07-Moda 08-ModB 09-Moda

Step by Step Solution

There are 3 Steps involved in it

1 Expert Approved Answer
Step: 1 Unlock blur-text-image
Question Has Been Solved by an Expert!

Get step-by-step solutions from verified subject matter experts

Step: 2 Unlock
Step: 3 Unlock

Students Have Also Explored These Related General Management Questions!