

Question: 3 The data in the table to the right are based on Commute Time Well-Being the results of a survey comparing the (in minutes) Score
3

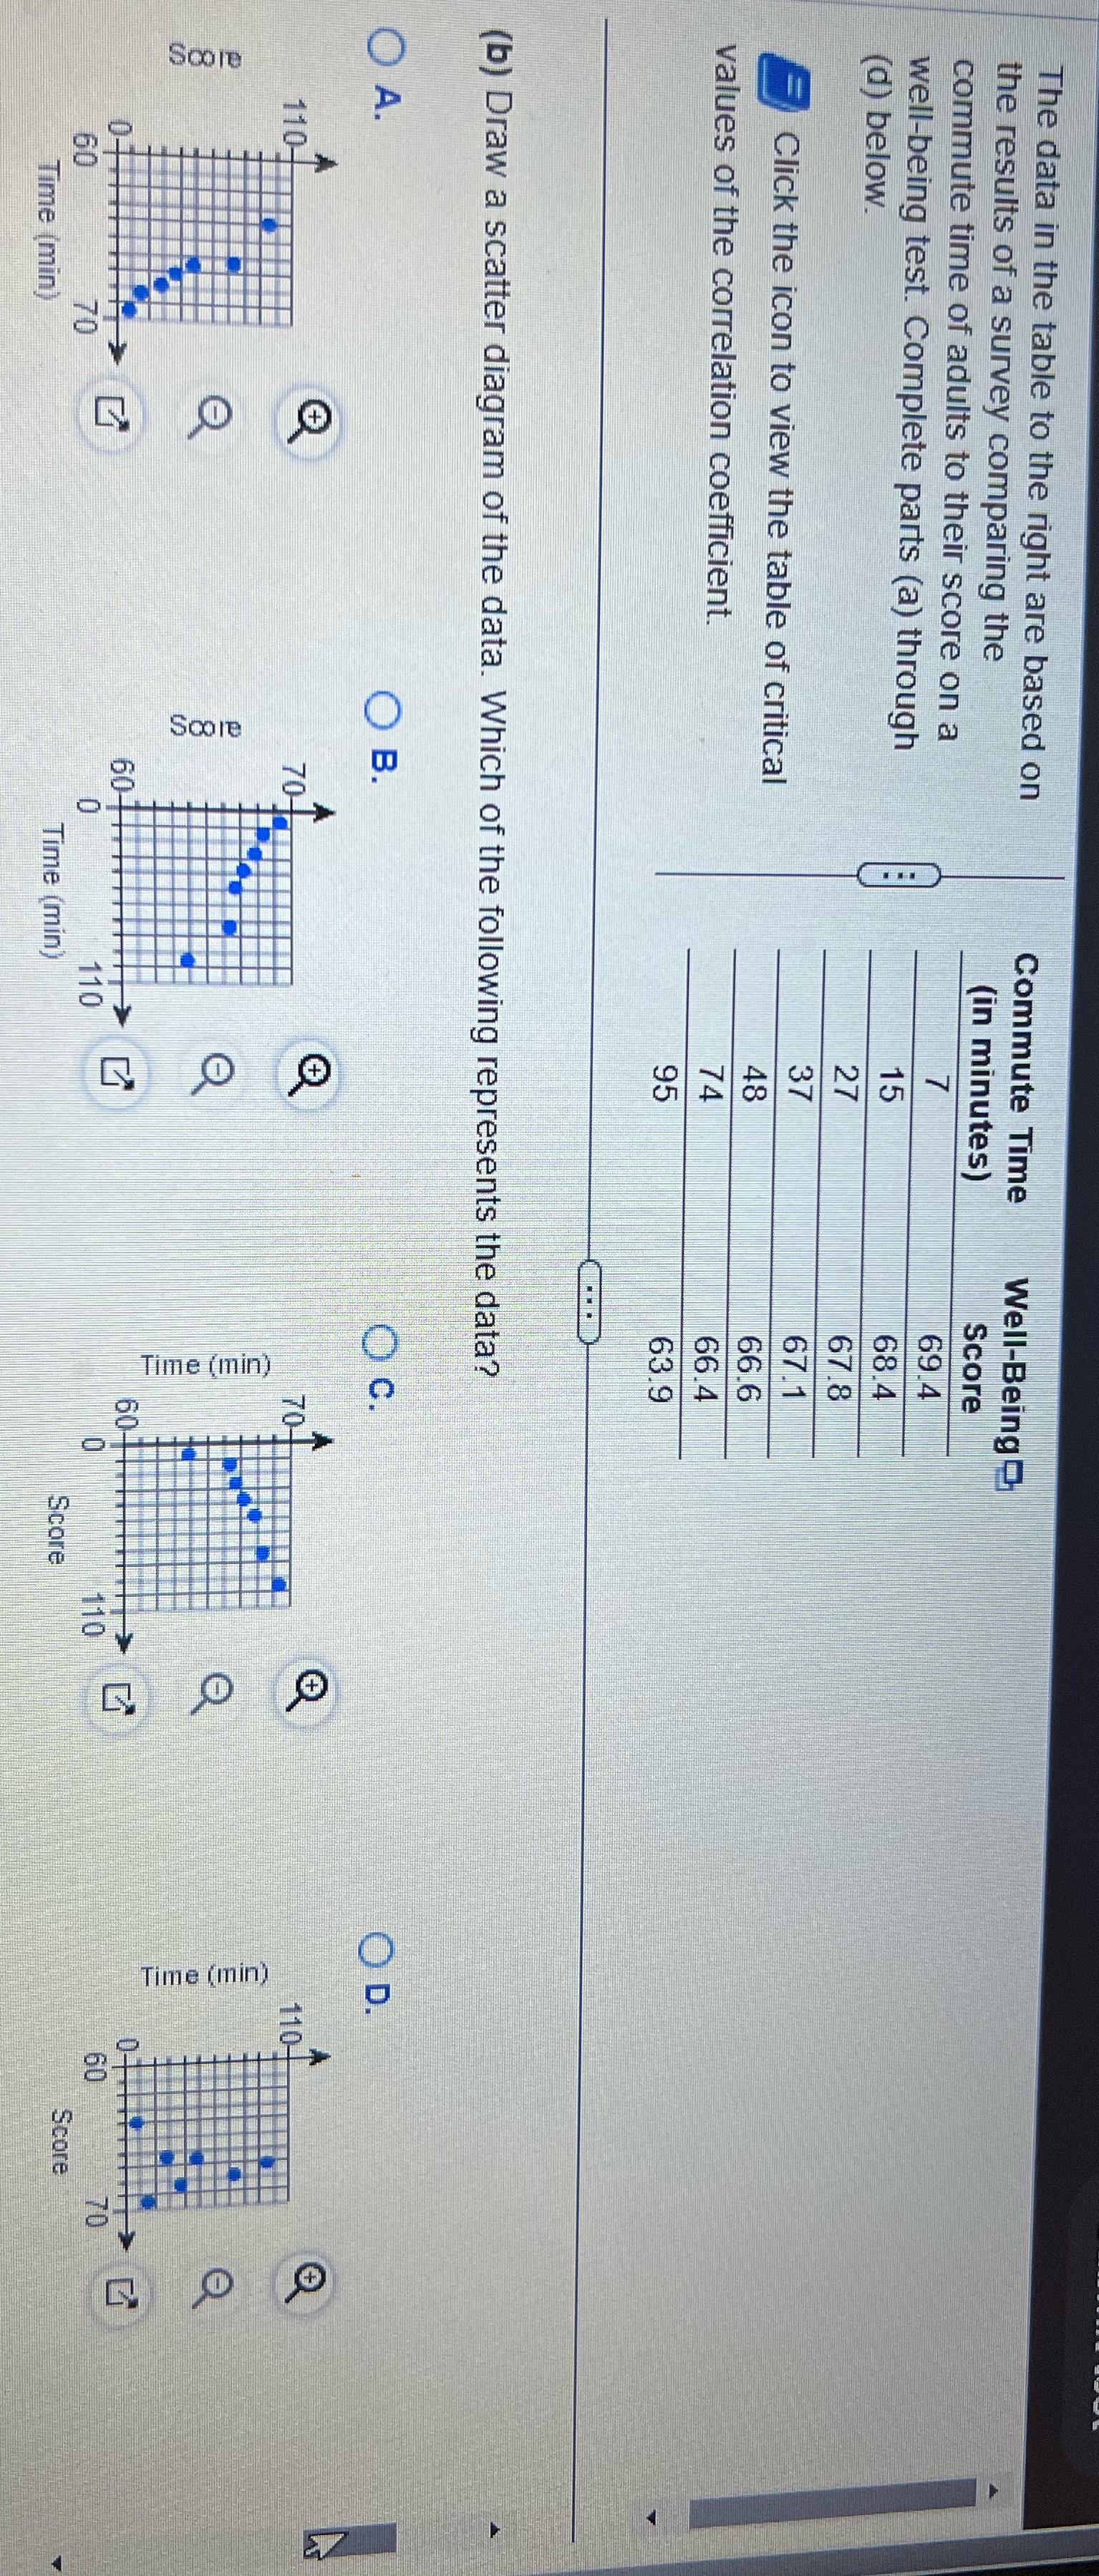
The data in the table to the right are based on Commute Time Well-Being the results of a survey comparing the (in minutes) Score commute time of adults to their score on a 69.4 well-being test. Complete parts (a) through 68.4 (d) below. 67.8 67.1 Click the icon to view the table of critical 66.6 values of the correlation coefficient. 66.4 63.9 (b) Draw a scatter diagram of the data. Which of the following represents the data? OD. O B. OC. 110- 110- Time (min) Time (min) O alcos alcos 0- 8 110 110 Score 70 Score Time (min) Time (min)
Step by Step Solution
There are 3 Steps involved in it
1 Expert Approved Answer
Step: 1 Unlock

Question Has Been Solved by an Expert!
Get step-by-step solutions from verified subject matter experts
Step: 2 Unlock
Step: 3 Unlock