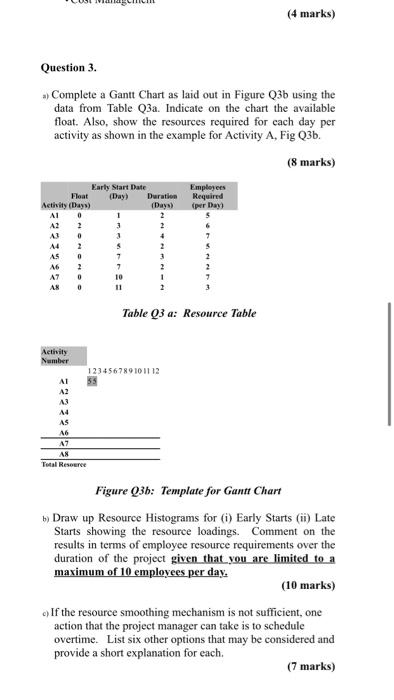
Question: (4 marks) Question 3. Complete a Gantt Chart as laid out in Figure Q3b using the data from Table Q3a. Indicate on the chart the

(4 marks) Question 3. Complete a Gantt Chart as
(4 marks) Question 3. Complete a Gantt Chart as laid out in Figure Q3b using the data from Table Q3a. Indicate on the chart the available float. Also, show the resources required for cach day per activity as shown in the example for Activity A, Fig Q3b. (8 marks) Employees Required (per Day) 6 Early Start Date Float (Day) Duration Activity (Days) Days) AI o 1 2 A2 2 3 2 AL 0 4 A4 2 5 ? AS o 7 3 A6 2 7 2 A7 0 10 1 AN 0 11 Table Q3 a: Resource Table Activity Number 123456789101112 AI AZ A4 AS A6 A7 AS Total Resource Figure Q3b: Template for Gantt Chart b) Draw up Resource Histograms for (i) Early Starts (m) Late Starts showing the resource loadings. Comment on the results in terms of employee resource requirements over the duration of the project given that you are limited to a maximum of 10 employees per day. (10 marks) .) If the resource smoothing mechanism is not sufficient, one action that the project manager can take is to schedule overtime. List six other options that may be considered and provide a short explanation for each. (7 marks)

Step by Step Solution

There are 3 Steps involved in it

1 Expert Approved Answer
Step: 1 Unlock blur-text-image
Question Has Been Solved by an Expert!

Get step-by-step solutions from verified subject matter experts

Step: 2 Unlock
Step: 3 Unlock

Students Have Also Explored These Related General Management Questions!