

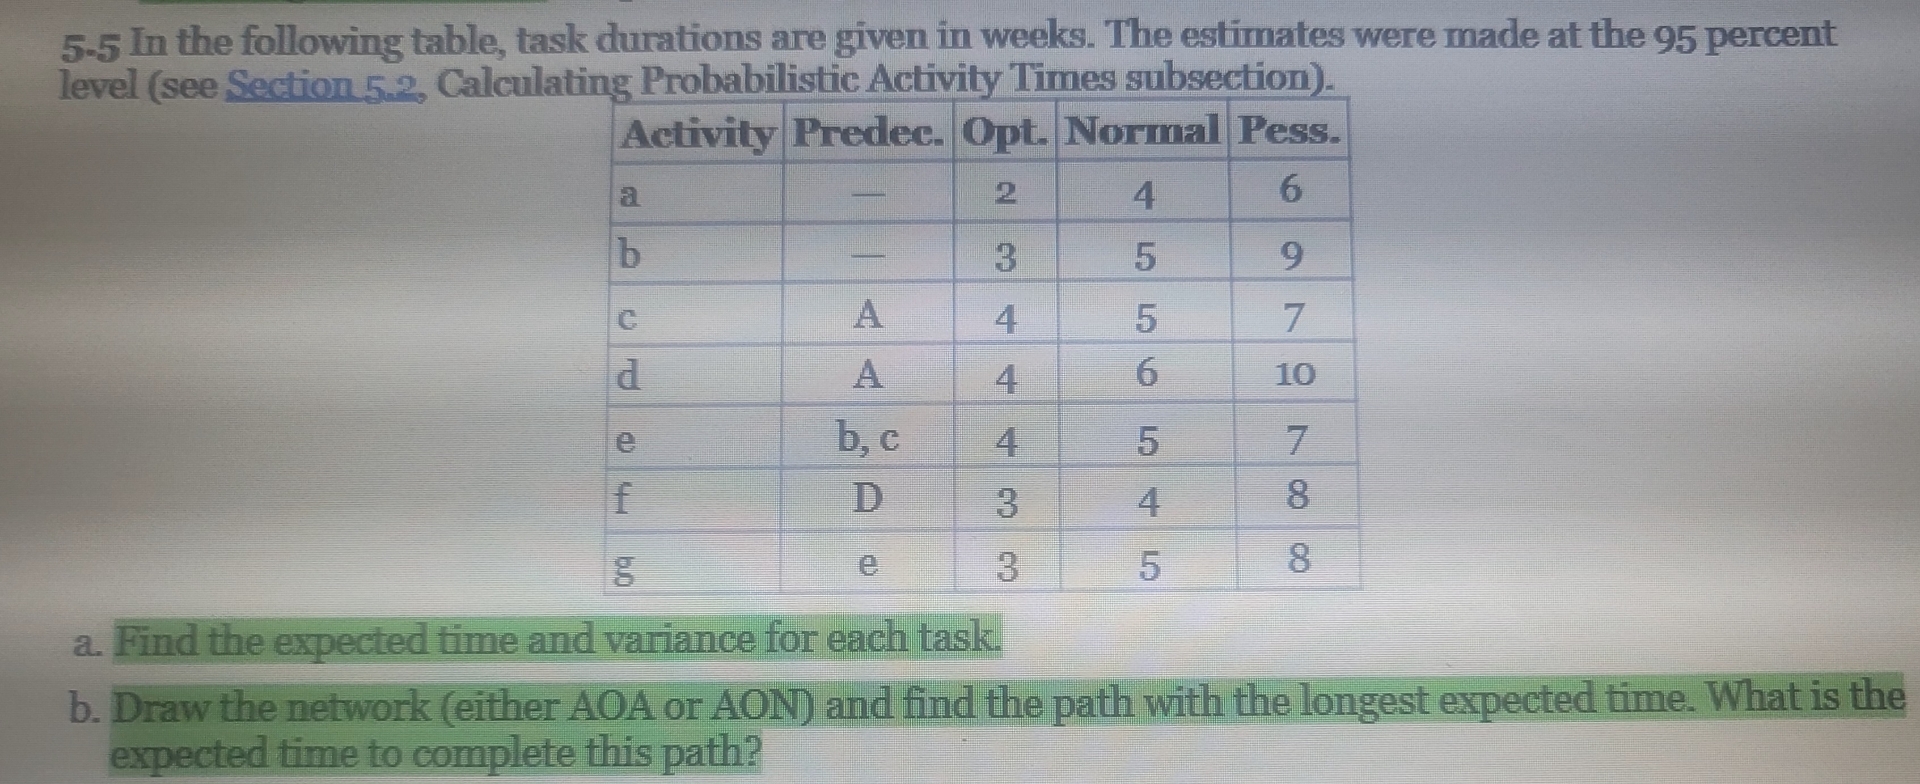
Question: 5 - 5 In the following table, task durations are given in weeks. The estimates were made at the 9 5 percent level ( see
In the following table, task durations are given in weeks. The estimates were made at the percent level see Section Calculating Probabilistic Activity Times subsection
tableActivityPredec.,Opt.,Norrmal,Pess.abcAdAeb cfDge
a Find the expected time and variance for each task.
b Draw the network either AOA or AON and find the path with the longest expected time. What is the expected time to complete this path?s
Step by Step Solution
There are 3 Steps involved in it
1 Expert Approved Answer
Step: 1 Unlock

Question Has Been Solved by an Expert!
Get step-by-step solutions from verified subject matter experts
Step: 2 Unlock
Step: 3 Unlock