

Question: 5 . 5 In the following table, task durations are given in weeks. The estimates were made at the 9 5 percent level ( see
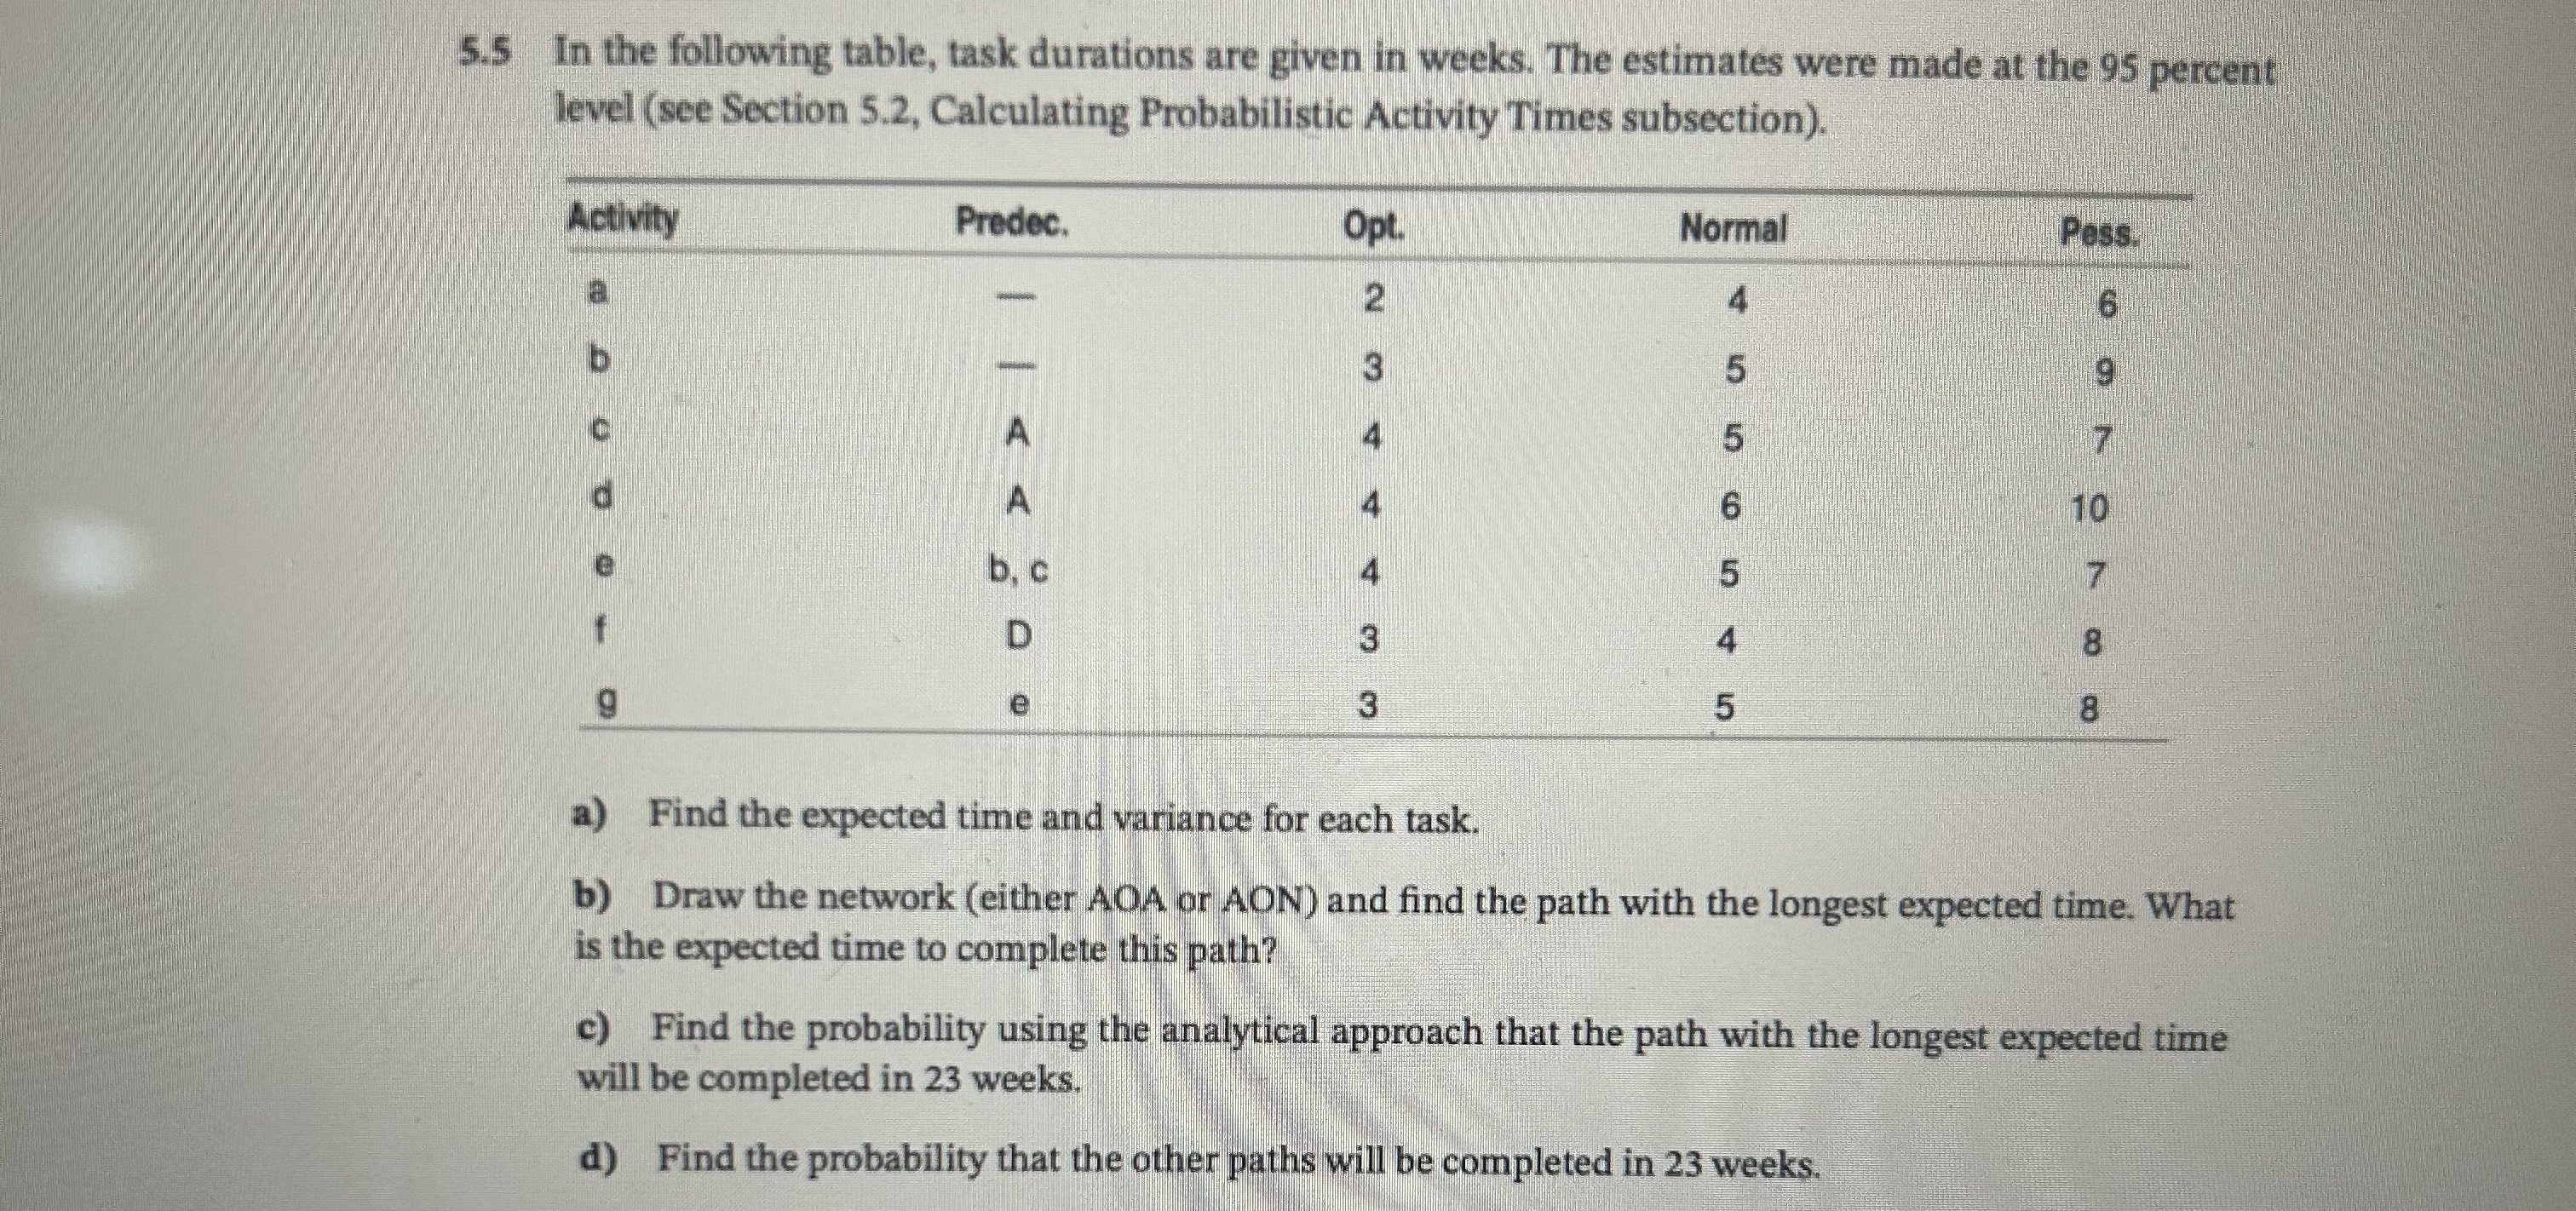
In the following table, task durations are given in weeks. The estimates were made at the percent level see Section Calculating Probabilistic Activity Times subsection
tableActivityPredec.,Opt.,Normal,Pess.abcAdAeb cfDge
a Find the expected time and variance for each task.
b Draw the network either AOA or AON and find the path with the longest expected time. What is the expected time to complete this path?
c Find the probability using the analytical approach that the path with the longest expected time will be completed in weeks.
d Find the probability that the other paths will be completed in weeks.
I need in depth what formulas for excel.
Step by Step Solution
There are 3 Steps involved in it
1 Expert Approved Answer
Step: 1 Unlock

Question Has Been Solved by an Expert!
Get step-by-step solutions from verified subject matter experts
Step: 2 Unlock
Step: 3 Unlock