

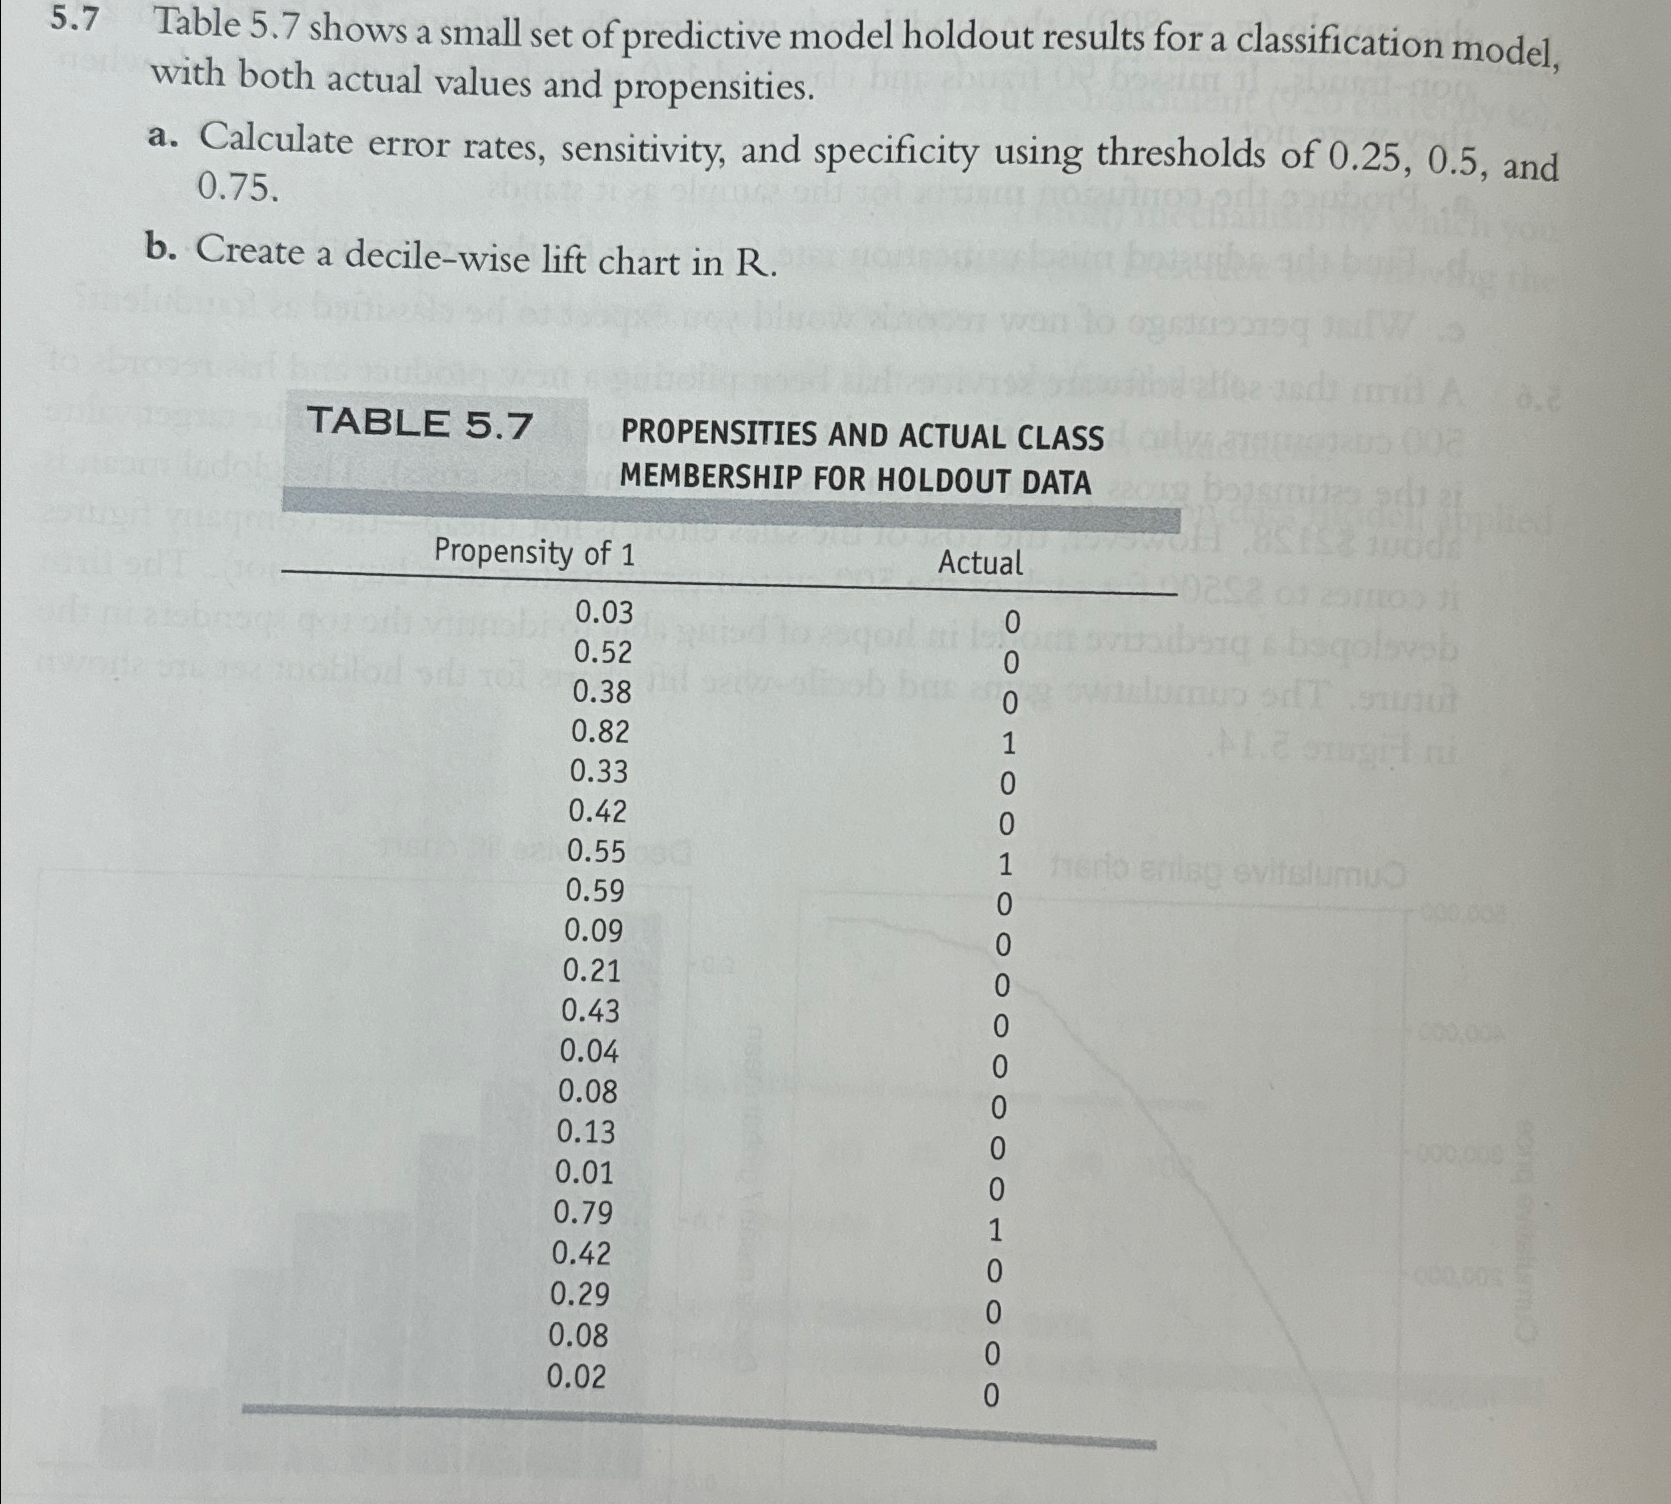
Question: 5 . 7 Table 5 . 7 shows a small set of predictive model holdout results for a classification model, with both actual values and
Table shows a small set of predictive model holdout results for a classification model, with both actual values and propensities.
a Calculate error rates, sensitivity and specificity using thresholds of and
b Create a decilewise lift chart in
TABLE
PROPENSITIES AND ACTUAL CLASS MEMBERSHIP FOR HOLDOUT DATA
tablePropensity of Actual
Step by Step Solution
There are 3 Steps involved in it
1 Expert Approved Answer
Step: 1 Unlock

Question Has Been Solved by an Expert!
Get step-by-step solutions from verified subject matter experts
Step: 2 Unlock
Step: 3 Unlock