

Question: Problem 5.2 Table 5.1 shows a small set of predictive model validation results for a classification model, with both actual values and propensities. a. Calculate
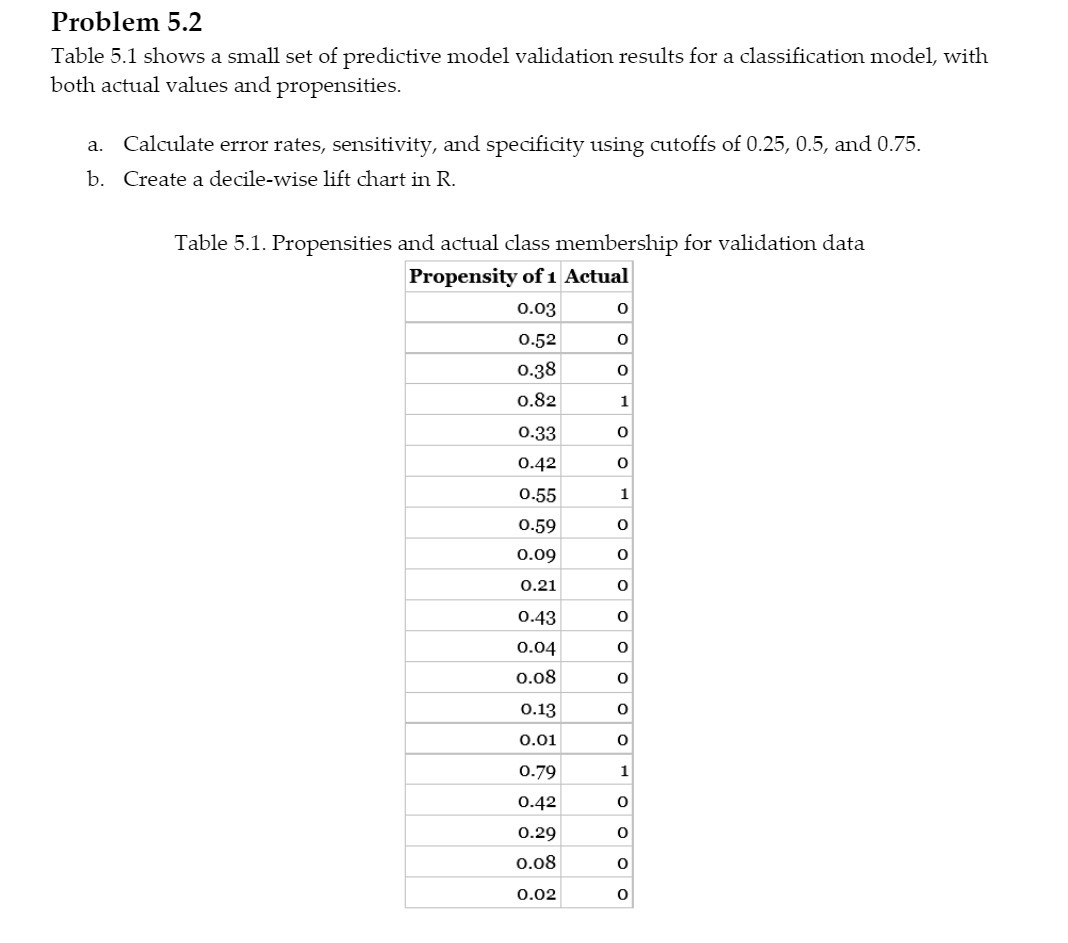
Problem 5.2 Table 5.1 shows a small set of predictive model validation results for a classification model, with both actual values and propensities. a. Calculate error rates, sensitivity, and specificity using cutoffs of 0.25, 0.5, and 0.75. b. Create a decile-wise lift chart in R. Table 5.1. Propensities and actual class membership for validation data Propensity of 1 Actual 0.03 o 0.52 O 0.38 O 0.82 0.33 0.42 0.55 HOO 0.59 0.09 0.21 0.43 0.04 0.08 0.13 o o 0.01 O 0.79 0.42 0.29 0.08 0.02 oooo
Step by Step Solution
There are 3 Steps involved in it
1 Expert Approved Answer
Step: 1 Unlock

Question Has Been Solved by an Expert!
Get step-by-step solutions from verified subject matter experts
Step: 2 Unlock
Step: 3 Unlock