

Question: 5.7 Table 5.5 shows a small set of predictive model validation results for a classification model, with both actual values and propensities. a. Calculate error
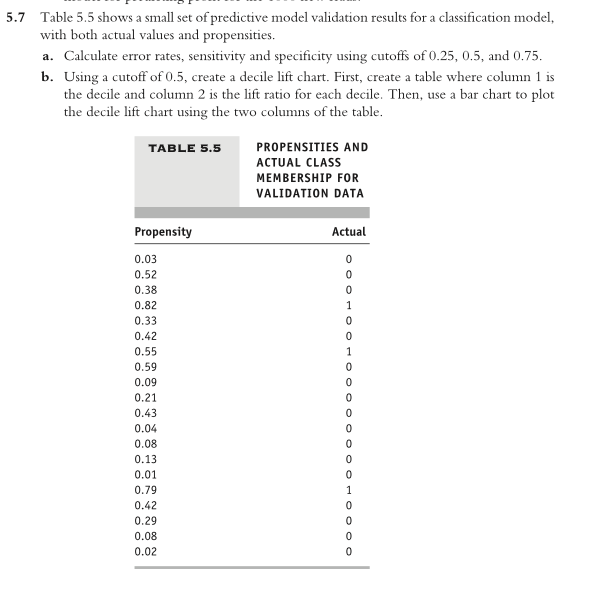

5.7 Table 5.5 shows a small set of predictive model validation results for a classification model, with both actual values and propensities. a. Calculate error rates, sensitivity and specificity using cutoffs of 0.25, 0.5, and 0.75. b. Using a cutoff of 0.5, create a decile lift chart. First, create a table where column 1 is the decile and column 2 is the lift ratio for each decile. Then, use a bar chart to plot the decile lift chart using the two columns of the table. TABLE 5.5 PROPENSITIES AND ACTUAL CLASS MEMBERSHIP FOR VALIDATION DATA Propensity Actual 0.03 0.52 0.38 0.82 0.33 0.42 0.55 0.59 0.09 0.21 D O O O H O O O O O O O O H O O H O D C 0.43 0.04 0.08 0.13 0.01 0.79 0.42 0.29 0.08 0.02
Step by Step Solution
There are 3 Steps involved in it

Get step-by-step solutions from verified subject matter experts