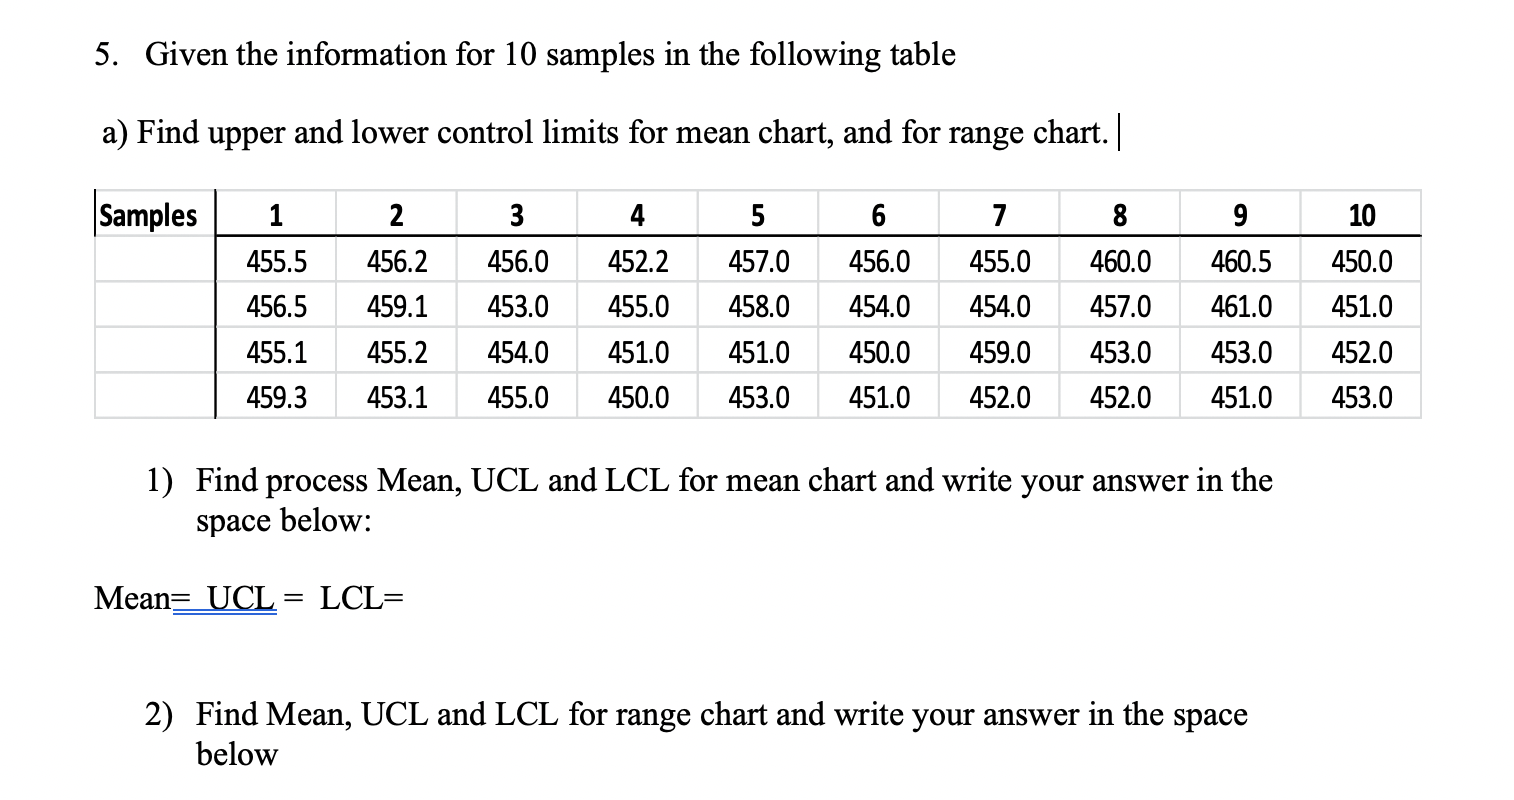
Question: 5. Given the information for 10 samples in the following table a) Find upper and lower control limits for mean chart, and for range chart.

5. Given the information for 10 samples in the

5. Given the information for 10 samples in the following table a) Find upper and lower control limits for mean chart, and for range chart. | Samples 1 5 3 456.0 455.5 457.0 2 456.2 459.1 455.2 453.1 456.5 455.1 459.3 453.0 4 452.2 455.0 451.0 450.0 6 456.0 454.0 450.0 451.0 458.0 451.0 453.0 7 455.0 454.0 459.0 452.0 8 460.0 457.0 453.0 452.0 9 460.5 461.0 453.0 451.0 10 450.0 451.0 452.0 453.0 454.0 455.0 1) Find process Mean, UCL and LCL for mean chart and write your answer in the space below: Mean= UCL LCL= 2) Find Mean, UCL and LCL for range chart and write your answer in the space below

Step by Step Solution

There are 3 Steps involved in it

1 Expert Approved Answer
Step: 1 Unlock blur-text-image
Question Has Been Solved by an Expert!

Get step-by-step solutions from verified subject matter experts

Step: 2 Unlock
Step: 3 Unlock

Students Have Also Explored These Related General Management Questions!