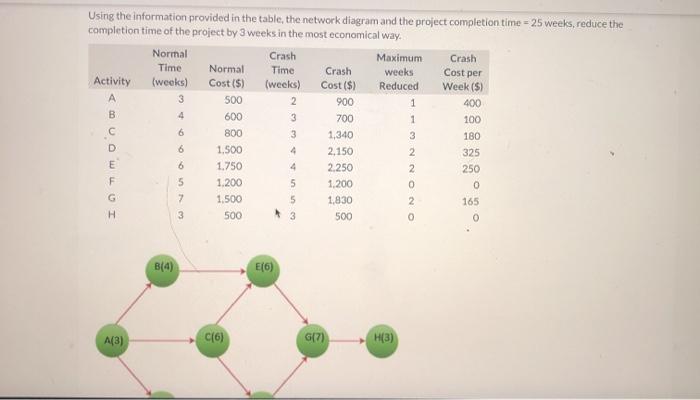
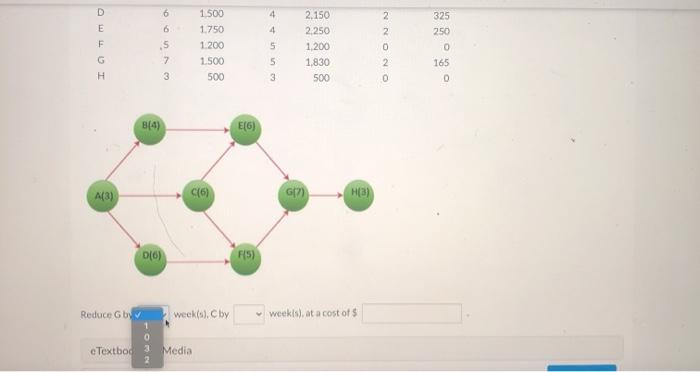
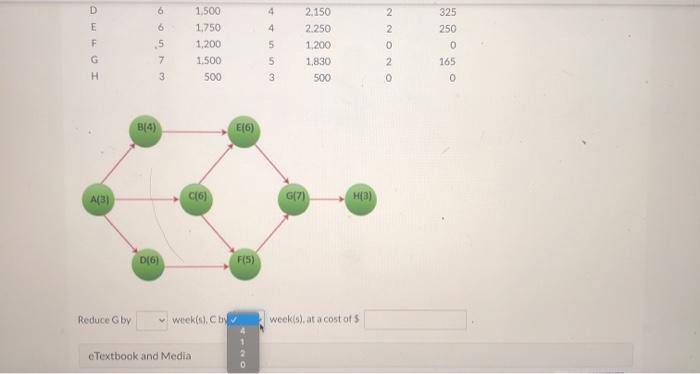
Question: 500 Using the information provided in the table, the network diagram and the project completion time = 25 weeks, reduce the completion time of the

500 Using the information provided in the table,
500 Using the information provided in the table, the network diagram and the project completion time = 25 weeks, reduce the completion time of the project by 3 weeks in the most economical way. Normal Crash Maximum Crash Time Normal Time Crash weeks Cost per Activity (weeks) Cost (5) (weeks) Cost ($) Reduced Week (5) A 3 2 900 1 400 B 4 600 3 700 1 100 6 800 3 1,340 3 180 D 6 1.500 4 2.150 2 325 E 6 1.750 4 2.250 2 250 F 5 1.200 5 1.200 0 G 7 1,500 5 2 165 H 3 500 500 0 Inmon> 1830 ONO E(6) A(3) C(6) G17) H(3) D 4 2 E 4 6 6 :5 2 1.500 1.750 1.200 1.500 500 2.150 2.250 1.200 1,830 500 NO 5 325 250 0 165 0 5 H 2 0 3 3 8(4) E(6) A(3) (6) 617 (3) D(0) (5) Reduce by weck), by w weekls), at a cost of 0 e TextbooMedia 2 D 4 E 6 6 5 4 F 1.500 1,750 1.200 1.500 500 2.150 2.250 1200 1.830 500 ON ONN 5 5 3 325 250 0 165 0 G 7 H 3 B[4) E(6) A(3) C(6) G[7 H(3) D(6) F(5) Reduce Gby weeks.Co weeks), at a cost of e Textbook and Media 0

Step by Step Solution

There are 3 Steps involved in it

1 Expert Approved Answer
Step: 1 Unlock blur-text-image
Question Has Been Solved by an Expert!

Get step-by-step solutions from verified subject matter experts

Step: 2 Unlock
Step: 3 Unlock

Students Have Also Explored These Related General Management Questions!