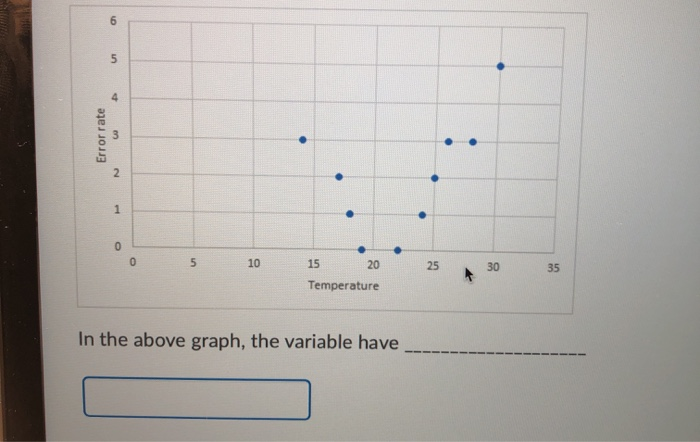
Question: 6 5 Error rate 3 N . 1 O 0 5 10 25 30 35 15 20 Temperature In the above graph, the variable have

6 5 Error rate 3 N . 1 O 0 5 10 25 30 35 15 20
6 5 Error rate 3 N . 1 O 0 5 10 25 30 35 15 20 Temperature In the above graph, the variable have 00 7 6 . Missed days . 0 10 20 50 60 70 30 40 Employee age In the above graph, the variables have a

Step by Step Solution

There are 3 Steps involved in it

1 Expert Approved Answer
Step: 1 Unlock blur-text-image
Question Has Been Solved by an Expert!

Get step-by-step solutions from verified subject matter experts

Step: 2 Unlock
Step: 3 Unlock

Students Have Also Explored These Related General Management Questions!