

Question: 8 Homework Problems i Saved 5 From the data below for Apple (AAPL) stock, calculate the upper and lower Bollinger bands, which represent plus (or
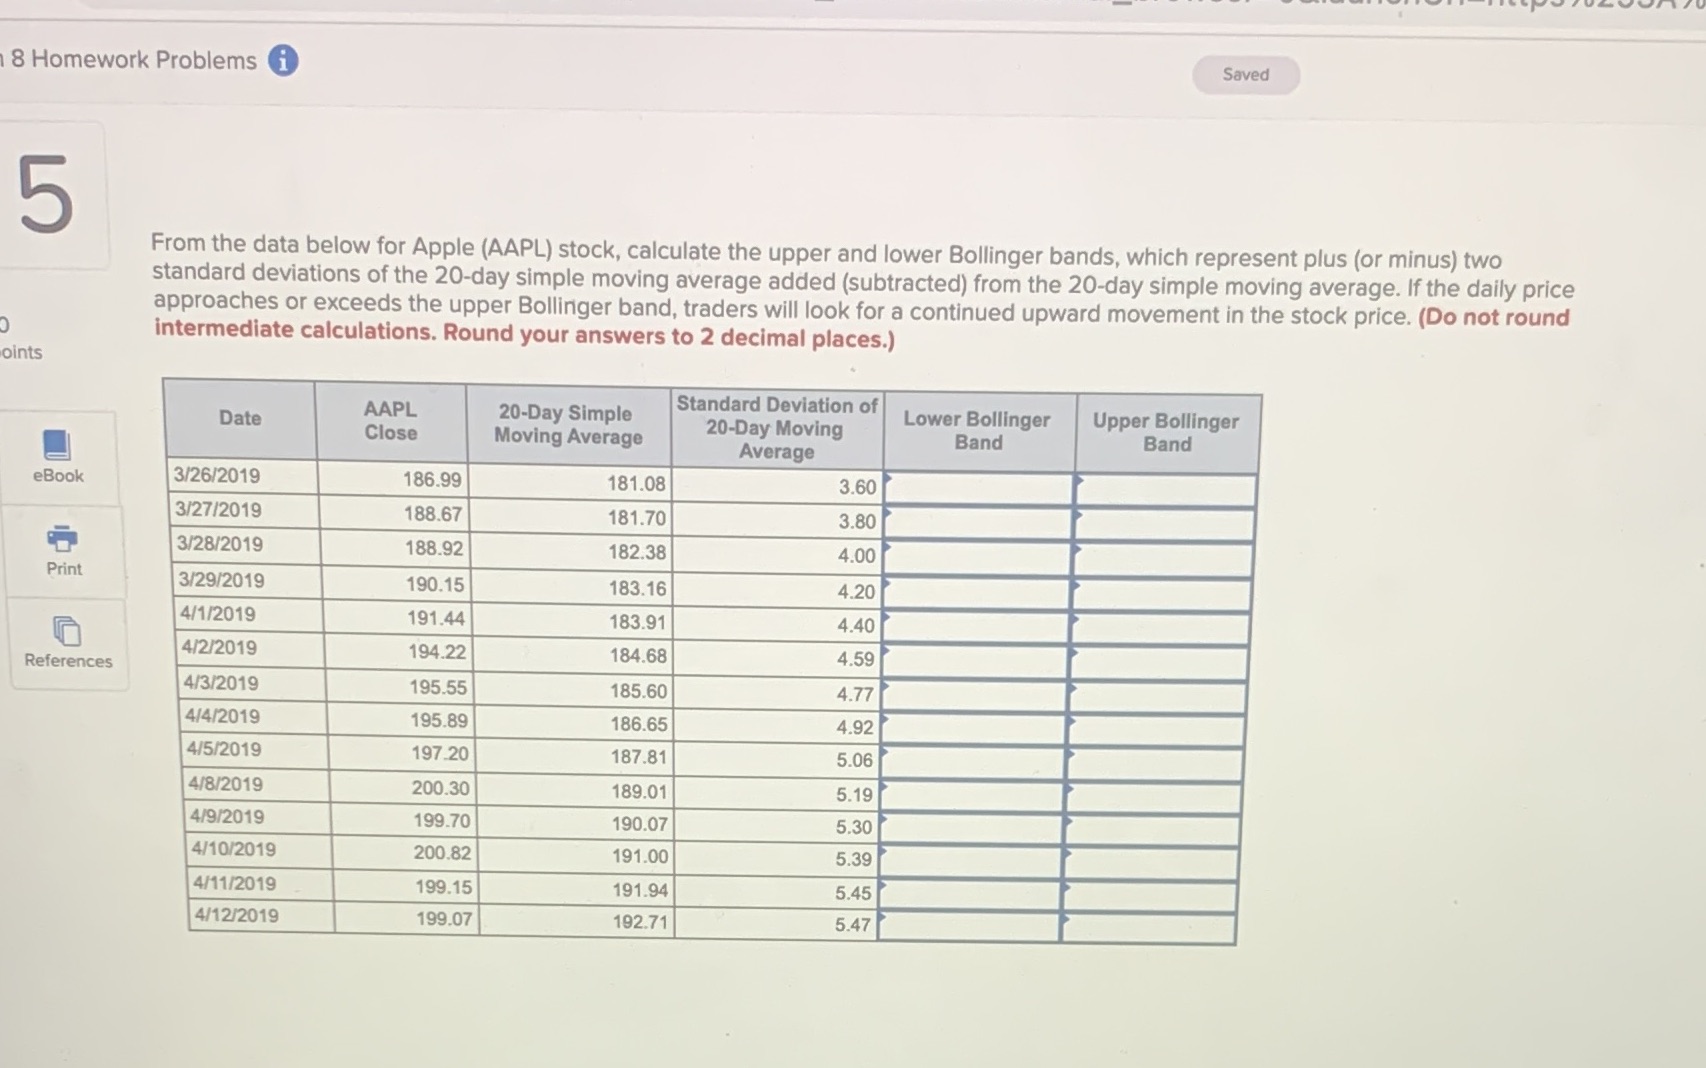
8 Homework Problems i Saved 5 From the data below for Apple (AAPL) stock, calculate the upper and lower Bollinger bands, which represent plus (or minus) two standard deviations of the 20-day simple moving average added (subtracted) from the 20-day simple moving average. If the daily price approaches or exceeds the upper Bollinger band, traders will look for a continued upward movement in the stock price. (Do not round intermediate calculations. Round your answers to 2 decimal places.) oints AAPL Standard Deviation of Date 20-Day Simple 20-Day Moving Lower Bollinger Upper Bollinger Close Moving Average Band Band Average eBook 3/26/2019 186.99 181.08 3.60 3/27/2019 188.67 181.70 3.80 3/28/2019 188.92 182.38 4.0 Print 3/29/2019 190.15 183.16 4.20 4/1/2019 191.44 183.91 4.40 4/2/2019 194.22 184.68 4.59 References 4/3/2019 195.55 185.60 4.77 4/4/2019 195.89 186.65 4.92 4/5/2019 197.20 187.81 5.06 4/8/2019 200.30 189.01 5.19 4/9/2019 199.70 190.07 5.30 4/10/2019 200.82 191.00 5.39 4/11/2019 199.15 191.94 5.45 4/12/2019 199.07 192.71 5.47
Step by Step Solution
There are 3 Steps involved in it

Get step-by-step solutions from verified subject matter experts