

Question: A boxplot for a sample data is shown below. There are no outliers -40 -20 0 20 40 60 Sampie Data 100 120 140
A boxplot for a sample data is shown below. There are no outliers
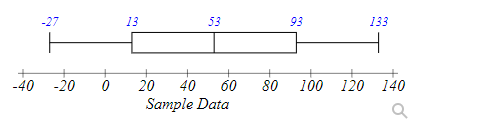
-40 -20 0 20 40 60 Sampie Data 100 120 140
Step by Step Solution
There are 3 Steps involved in it
1 Expert Approved Answer
Step: 1 Unlock

Question Has Been Solved by an Expert!
Get step-by-step solutions from verified subject matter experts
Step: 2 Unlock
Step: 3 Unlock