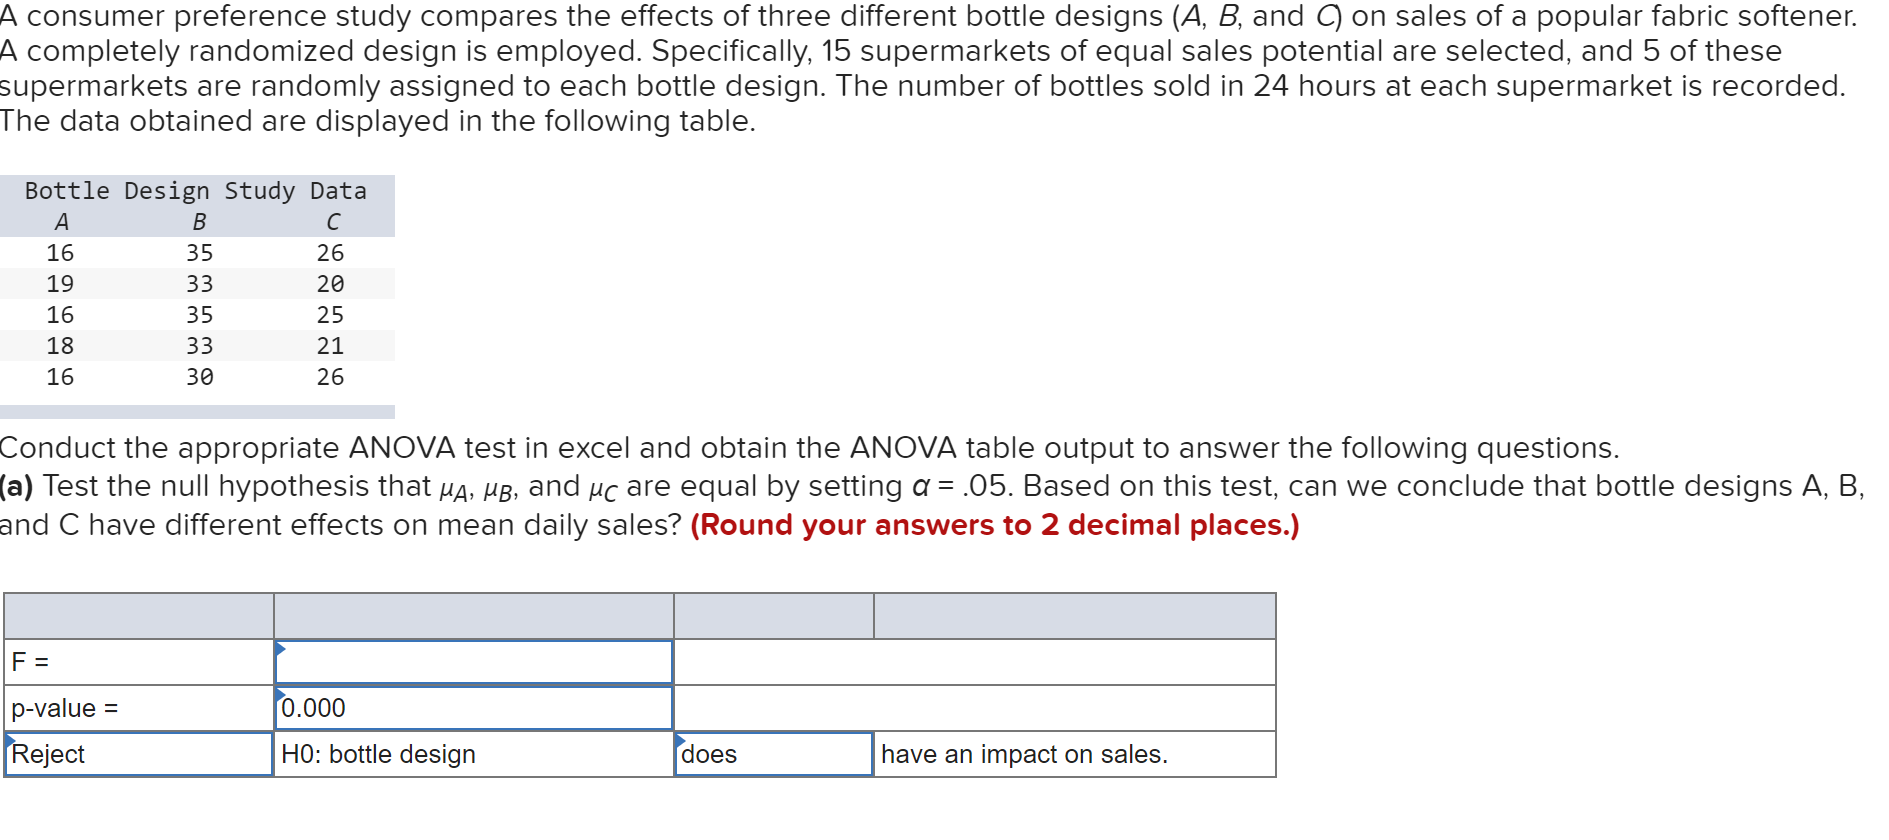
Question: A consumer preference study compares the effects of three different bottle designs (A, B, and on sales of a popular fabric softener. A completely randomized

A consumer preference study compares the effectsA consumer preference study compares the effects

A consumer preference study compares the effects of three different bottle designs (A, B, and on sales of a popular fabric softener. A completely randomized design is employed. Specifically, 15 supermarkets of equal sales potential are selected, and 5 of these supermarkets are randomly assigned to each bottle design. The number of bottles sold in 24 hours at each supermarket is recorded. The data obtained are displayed in the following table. Bottle Design Study Data A B 16 35 26 19 33 20 16 35 25 18 33 21 16 30 26 Conduct the appropriate ANOVA test in excel and obtain the ANOVA table output to answer the following questions. (a) Test the null hypothesis that ua, ub, and uc are equal by setting a = .05. Based on this test, can we conclude that bottle designs A, B, and C have different effects on mean daily sales? (Round your answers to 2 decimal places.) F = = 0.000 p-value Reject HO: bottle design does have an impact on sales. (b) Consider the pairwise differences uB - 4A, MC - MA, and uc - ub. Find a point estimate of and a Tukey simultaneous 95 percent confidence interval for each pairwise difference. Interpret the results in practical terms. Which bottle design maximizes mean daily sales? (Round your answers to 2 decimal places. Negative amounts should be indicated by a minus sign.) Point estimate Confidence interval UB -JA: UC-uA: C-UB: , [ 1 [ , [ ] ] 1

Step by Step Solution

There are 3 Steps involved in it

1 Expert Approved Answer
Step: 1 Unlock blur-text-image
Question Has Been Solved by an Expert!

Get step-by-step solutions from verified subject matter experts

Step: 2 Unlock
Step: 3 Unlock

Students Have Also Explored These Related General Management Questions!