

Question: A quality analyst wants to construct a control chart for de machines all producing the same product are under contr particular quality variable Accordingly he

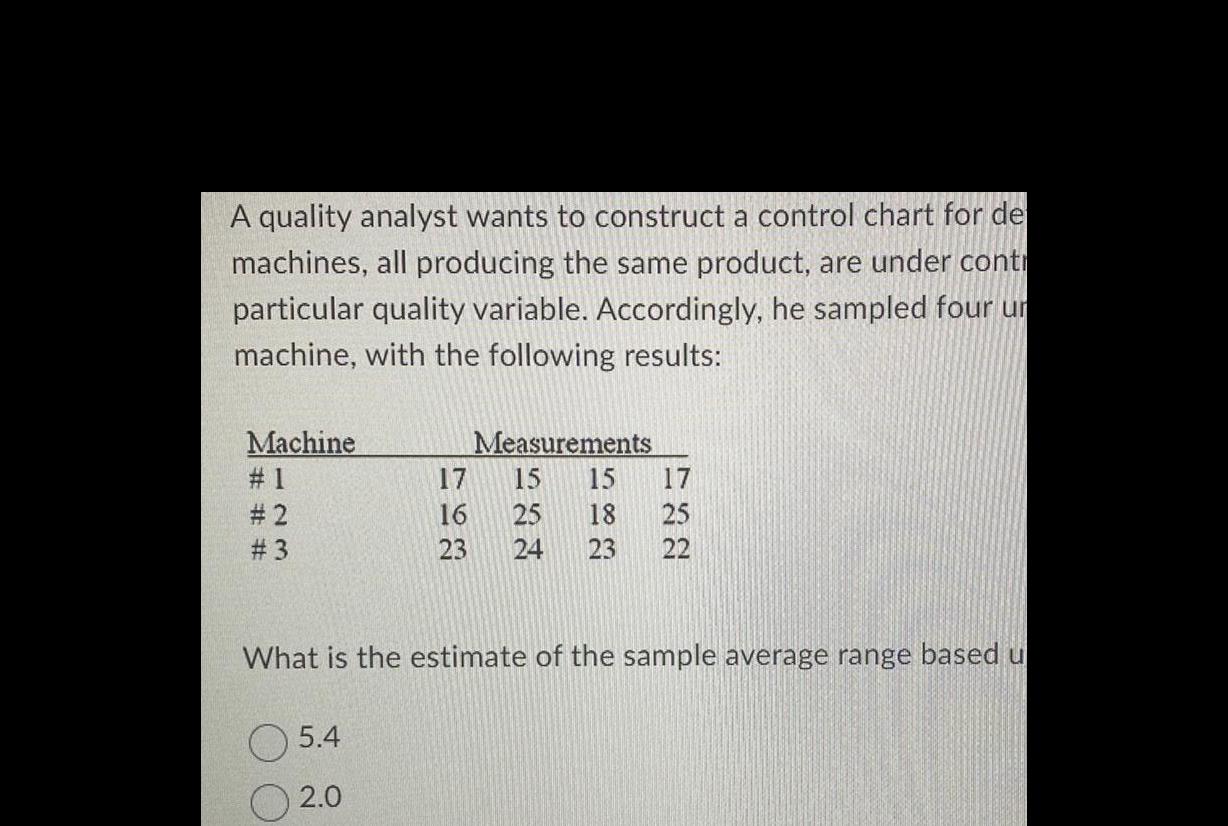
A quality analyst wants to construct a control chart for de machines all producing the same product are under contr particular quality variable Accordingly he sampled four un machine with the following results Machine 1 2 3 17 16 23 5 4 2 0 Measurements 422 15 25 15 17 18 25 23 22 What is the estimate of the sample average range based u
Step by Step Solution
There are 3 Steps involved in it
1 Expert Approved Answer
Step: 1 Unlock

Question Has Been Solved by an Expert!
Get step-by-step solutions from verified subject matter experts
Step: 2 Unlock
Step: 3 Unlock