

Question: A Quality Analyst wants to construct a control chart for determining whether three machines, all producing the same product, are under control with regard to
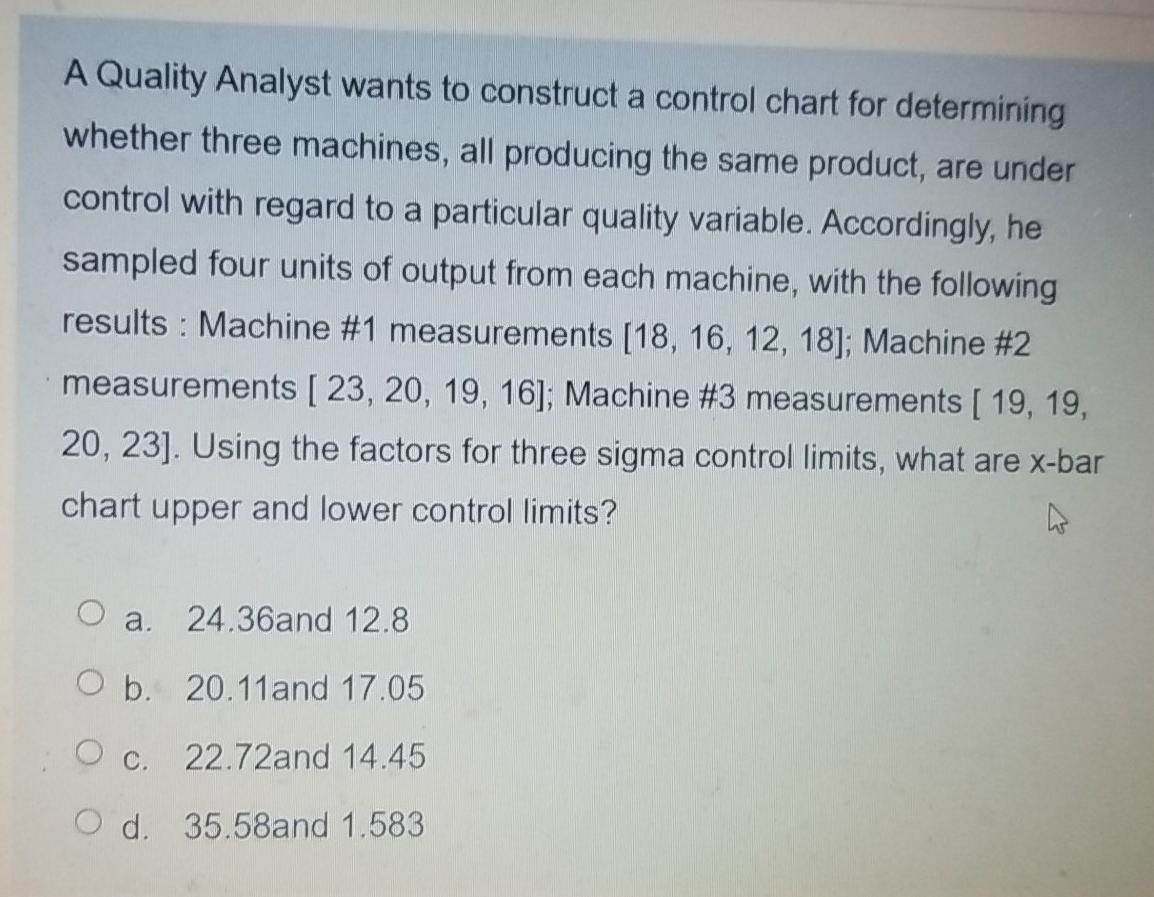
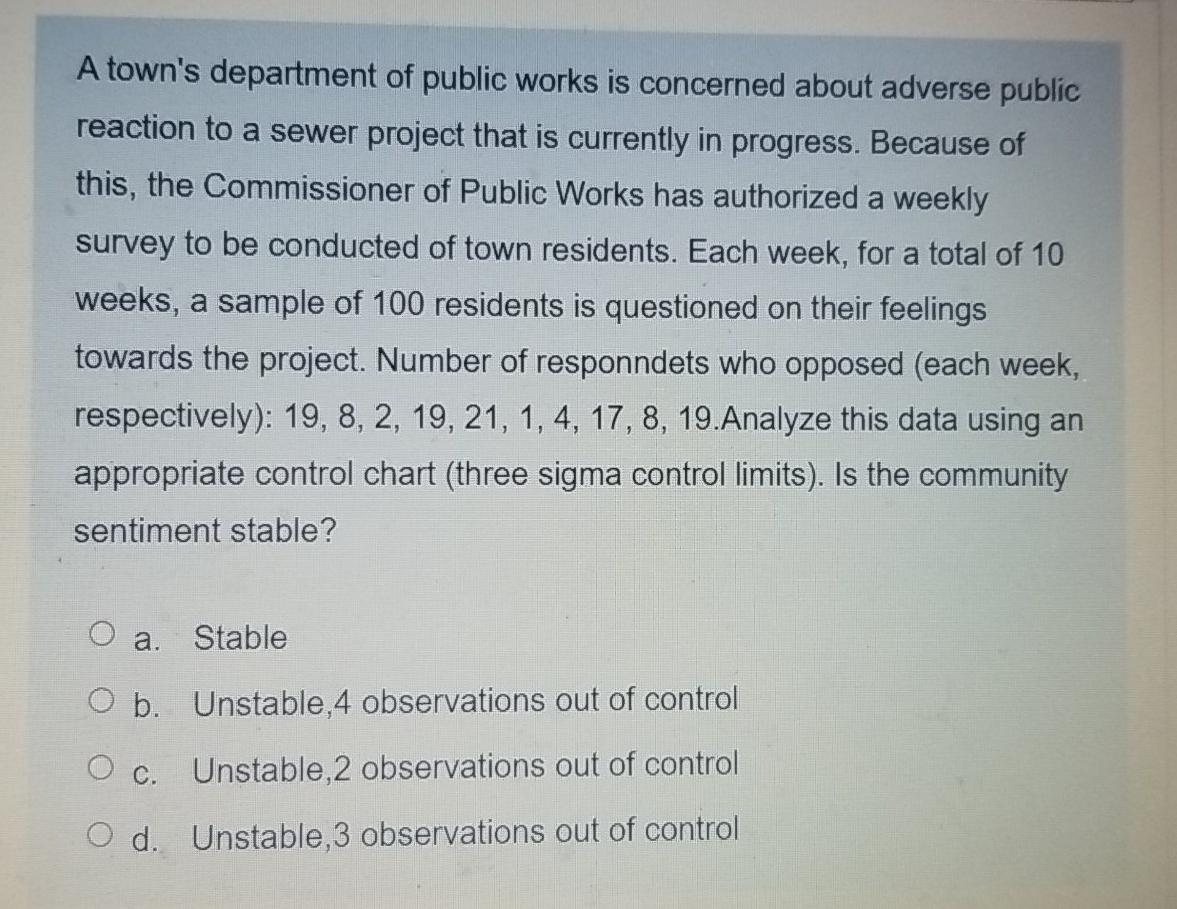
A Quality Analyst wants to construct a control chart for determining whether three machines, all producing the same product, are under control with regard to a particular quality variable. Accordingly, he sampled four units of output from each machine, with the following results : Machine #1 measurements (18, 16, 12, 18]; Machine #2 measurements [ 23, 20, 19, 16]; Machine #3 measurements [ 19, 19, 20, 23]. Using the factors for three sigma control limits, what are x-bar chart upper and lower control limits? a. 24.36and 12.8 O b. 20.11and 17.05 c. 22.72and 14.45 O d. 35.58and 1.583 A town's department of public works is concerned about adverse public reaction to a sewer project that is currently in progress. Because of this, the Commissioner of Public Works has authorized a weekly survey to be conducted of town residents. Each week, for a total of 10 weeks, a sample of 100 residents is questioned on their feelings towards the project. Number of responndets who opposed (each week, respectively): 19, 8, 2, 19, 21, 1, 4, 17, 8, 19. Analyze this data using an appropriate control chart (three sigma control limits). Is the community sentiment stable? O a. Stable O b. Unstable, 4 observations out of control O c. Unstable,2 observations out of control O d. Unstable, 3 observations out of control
Step by Step Solution
There are 3 Steps involved in it
1 Expert Approved Answer
Step: 1 Unlock

Question Has Been Solved by an Expert!
Get step-by-step solutions from verified subject matter experts
Step: 2 Unlock
Step: 3 Unlock