

Question: AFTER you created the control chart limits as shown above, the employees in the process took samples as specified. Remember, the employees always use
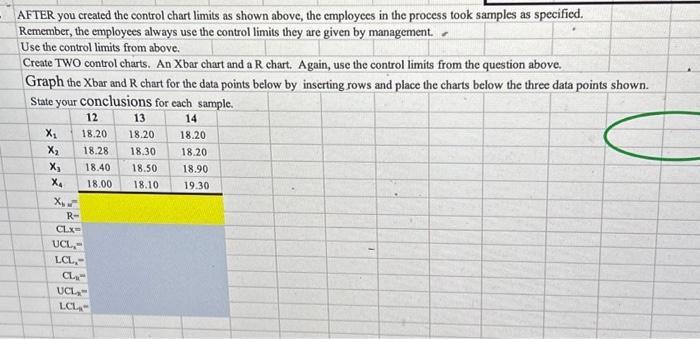
AFTER you created the control chart limits as shown above, the employees in the process took samples as specified. Remember, the employees always use the control limits they are given by management. Use the control limits from above. Create TWO control charts. An Xbar chart and a R chart. Again, use the control limits from the question above. Graph the Xbar and R chart for the data points below by inserting rows and place the charts below the three data points shown. State your conclusions for each sample. 14 18.20 X X X X X, 12 13 18.201 18.20 18.28 18.30 18.40 18.50 18.00 18.10 R- CLX= UCL- LCL,- CL UCL LCL 18.20 18.90 19.30
Step by Step Solution
3.39 Rating (146 Votes )
There are 3 Steps involved in it
The image youve provided includes a table with sample measurements for what appears to be a process ... View full answer

Get step-by-step solutions from verified subject matter experts