

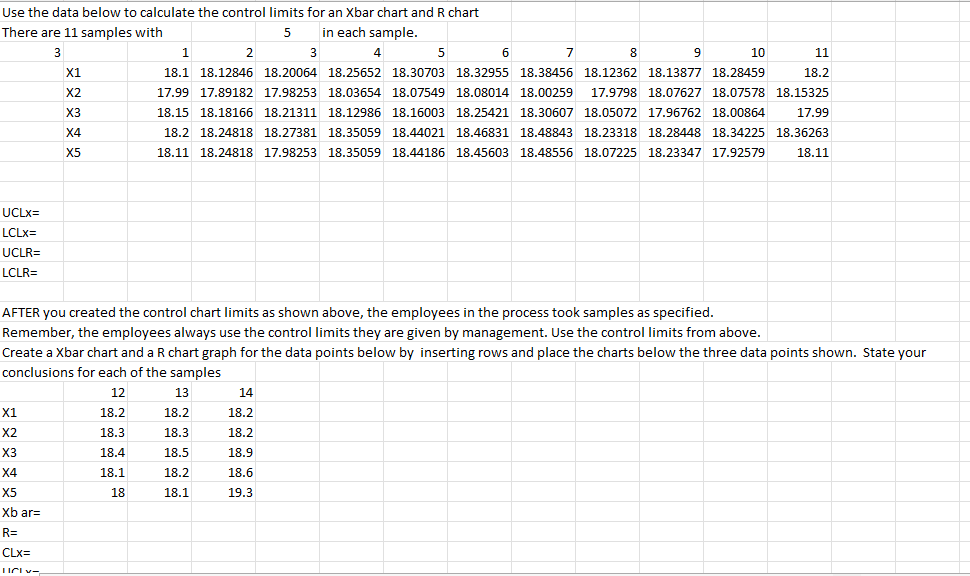
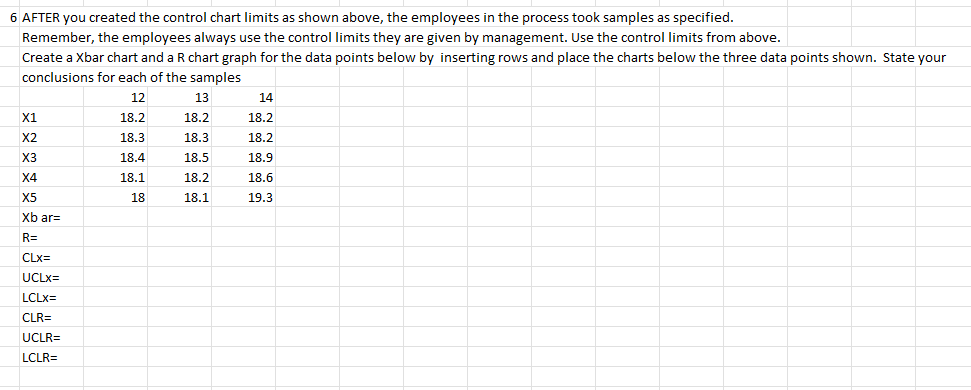
Question: Use the data below to calculate the control limits for an Xbar chart and R chart There are 11 samples with 5 in each sample.
Step by Step Solution
There are 3 Steps involved in it
1 Expert Approved Answer
Step: 1 Unlock

Question Has Been Solved by an Expert!
Get step-by-step solutions from verified subject matter experts
Step: 2 Unlock
Step: 3 Unlock