

Question: Answer questions 14 & 15 14 15 18 Use the data below to calculate the control limits for an Xbar chart and R chart There
Answer questions 14 & 15 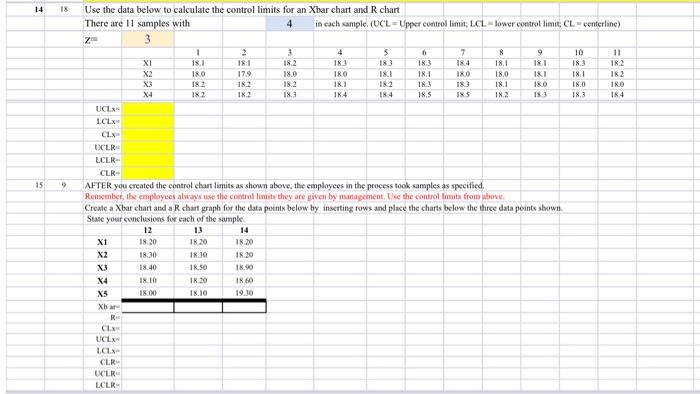
14 15 18 Use the data below to calculate the control limits for an Xbar chart and R chart There are 11 samples with 4 in each sample. (UCL-Upper control limit; LCL-lower control limit; CL-centerline) Z= 3 1 3 4 5 6 7 8 9 10 11 XI 18.1 18:1 18.2 18.3 18.3 18.3 18.4 18.1 18.1 18.3 18.2 X2 18.0 17.9 18.0 180 18.1 18.1 18.0 18.0 18.1 18.1 18.2 X3 18.2 18.2 18.2 18.1 18.2 18.3 183 18.1 18.0 18.0 18.0 X4 18.2 18.2 18.3 184 184 18.5 18.5 18.2 183 18.3 18.4 UCLX LCLX CLX UCLR LCLR- CLR- 9 AFTER you created the control chart limits as shown above, the employees in the process took samples as specified. Remember, the employees always use the control limits they are given by management. Use the control limits from above. Create a Xbar chart and a R chart graph for the data points below by inserting rows and place the charts below the three data points shown State your conclusions for each of the sample. 12 13 14 XI 18.20 18.20 18.20 18.30 18.30 18.20 18.40 18.50 18.90 18.10. 18.20 18,60 18.00 18.10 19.30 222222 X2 X3 X4 X5 Xb ar CLA UCLA LCLX CLR UCLR LCLR R= ~*~** 2
Step by Step Solution
There are 3 Steps involved in it
1 Expert Approved Answer
Step: 1 Unlock

Question Has Been Solved by an Expert!
Get step-by-step solutions from verified subject matter experts
Step: 2 Unlock
Step: 3 Unlock