

Question: Which of the following curves represents the graphs of pH during the titration of NaOH&HCl solutions? (A) pH Volof NaOH (B) pH Folaf NaH
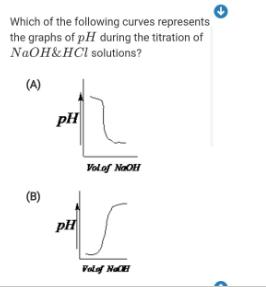
Which of the following curves represents the graphs of pH during the titration of NaOH&HCl solutions? (A) pH Volof NaOH (B) pH Folaf NaH
Step by Step Solution
★★★★★
3.44 Rating (157 Votes )
There are 3 Steps involved in it
1 Expert Approved Answer
Step: 1 Unlock

Question Has Been Solved by an Expert!
Get step-by-step solutions from verified subject matter experts
Step: 2 Unlock
Step: 3 Unlock