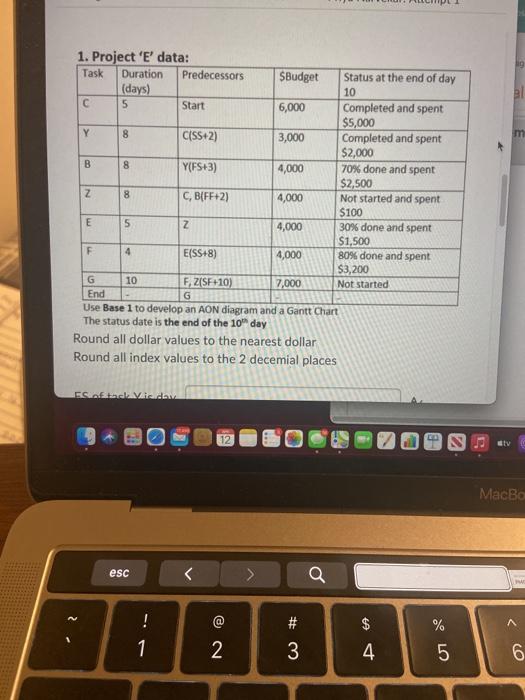
Question: B 1. Project 'E' data: Task Duration Predecessors SBudget Status at the end of day (days) 10 5 Start 6,000 Completed and spent $5,000 Y

B 1. Project 'E' data: Task Duration Predecessors
B 1. Project 'E' data: Task Duration Predecessors SBudget Status at the end of day (days) 10 5 Start 6,000 Completed and spent $5,000 Y 8 CISS+2) 3,000 Completed and spent $2,000 B 8 Y(FS+3) 4,000 70% done and spent $2,500 Z 8 C, BIFF+2) 4,000 Not started and spent $100 E 5 Z 4,000 30% done and spent $1,500 F 4 E(SS+8) 4,000 80% done and spent $3,200 G 10 F ZISF+10) 7,000 Not started End G Use Base 1 to develop an AON diagram and a Gantt Chart The status date is the end of the 10 day Round all dollar values to the nearest dollar Round all index values to the 2 decemial places svadu 12 Sav MacBo esc

Step by Step Solution

There are 3 Steps involved in it

1 Expert Approved Answer
Step: 1 Unlock blur-text-image
Question Has Been Solved by an Expert!

Get step-by-step solutions from verified subject matter experts

Step: 2 Unlock
Step: 3 Unlock

Students Have Also Explored These Related General Management Questions!