

Question: Based on the sampling done, the control limits for 3-sigma x chart are Do not worry about the answers that are already there. Refer to
Based on the sampling done, the control limits for 3-sigma x chart are
Do not worry about the answers that are already there.
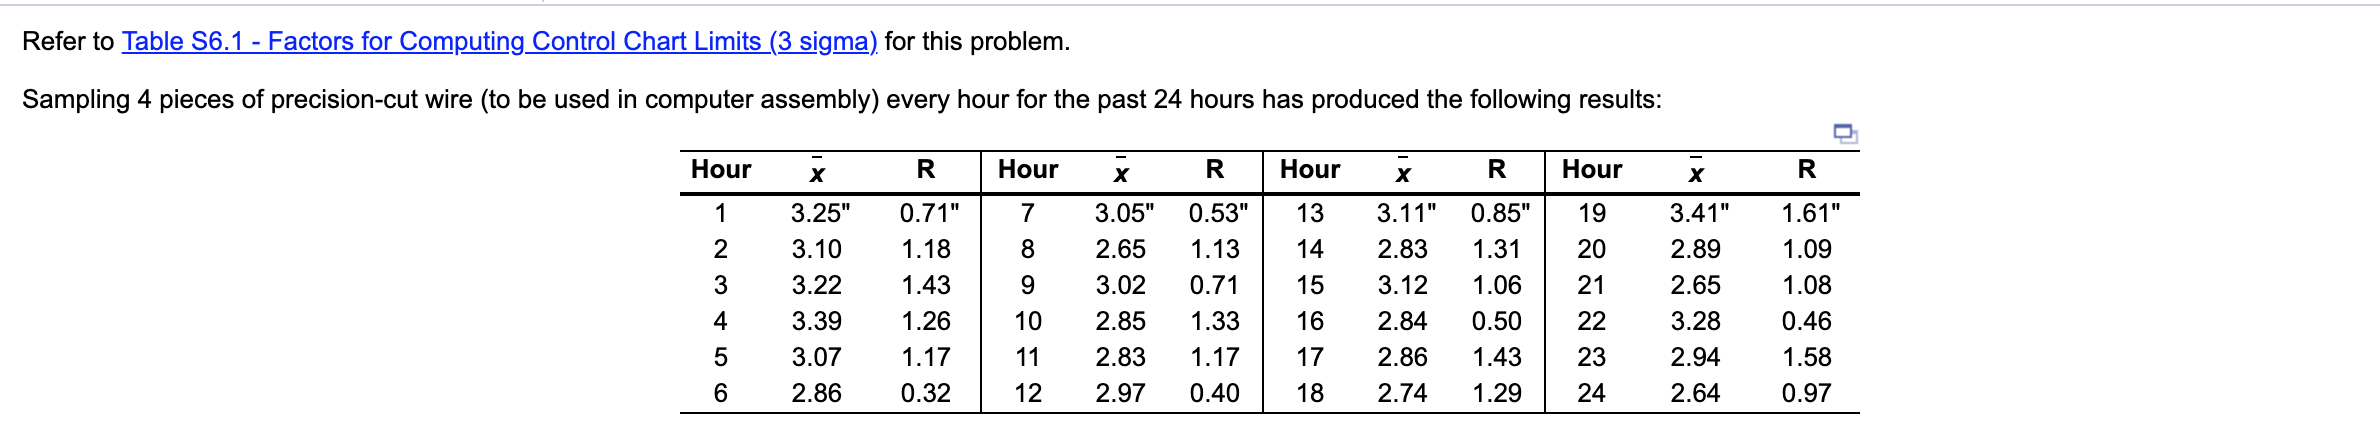
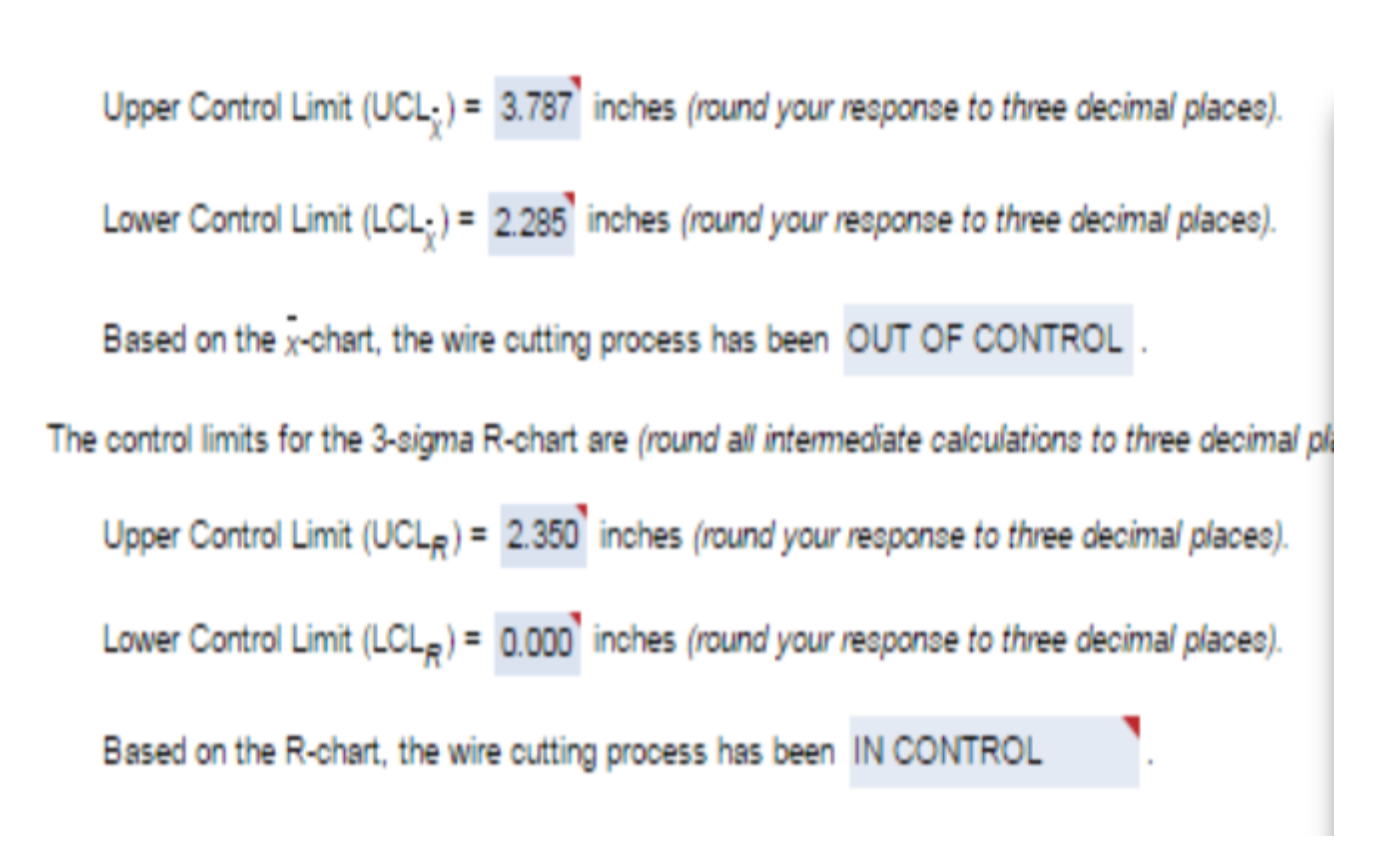
Refer to Table 56.1 - Factors for Computing Control Chart Limits (3 sigma) for this problem. Sampling 4 pieces of precision-cut wire (to be used in computer assembly) every hour for the past 24 hours has produced the following results: Hour R Hour R Hour R Hour R 1 7 2 8 3 3.25" 3.10 3.22 3.39 3.07 2.86 9 0.71" 1.18 1.43 1.26 1.17 0.32 3.05" 2.65 3.02 2.85 2.83 2.97 0.53" 1.13 0.71 1.33 1.17 0.40 13 14 15 16 17 3.11" 2.83 3.12 2.84 2.86 2.74 19 20 21 22 0.85" 1.31 1.06 0.50 1.43 1.29 3.41" 2.89 2.65 3.28 2.94 2.64 1.61" 1.09 1.08 0.46 1.58 0.97 4 5 10 11 12 23 24 6 18 Upper Control Limit (UCL;) = 3.787 inches (round your response to three decimal places). Lower Control Limit (LCL;) = 2.295 inches (round your response to three decimal places). Based on the x-chart , the wire cutting process has been OUT OF CONTROL The control limits for the 3-sigma R-chart are (round all intermediate calculations to three decimal pl Upper Control Limit (UCLp) = 2.350 inches (round your response to three decimal places) Lower Control Limit (LCLp) = 0.000) inches (round your response to three decimal places). Based on the R-chart, the wire cutting process has been IN CONTROLStep by Step Solution
There are 3 Steps involved in it
1 Expert Approved Answer
Step: 1 Unlock

Question Has Been Solved by an Expert!
Get step-by-step solutions from verified subject matter experts
Step: 2 Unlock
Step: 3 Unlock