

Question: Based on the table and graph above, what is the Sharpe Ratio of the Final Combination portfolio (FC)? 3-Stock Portfolio Opportunity Set Summary W1 Var(p)
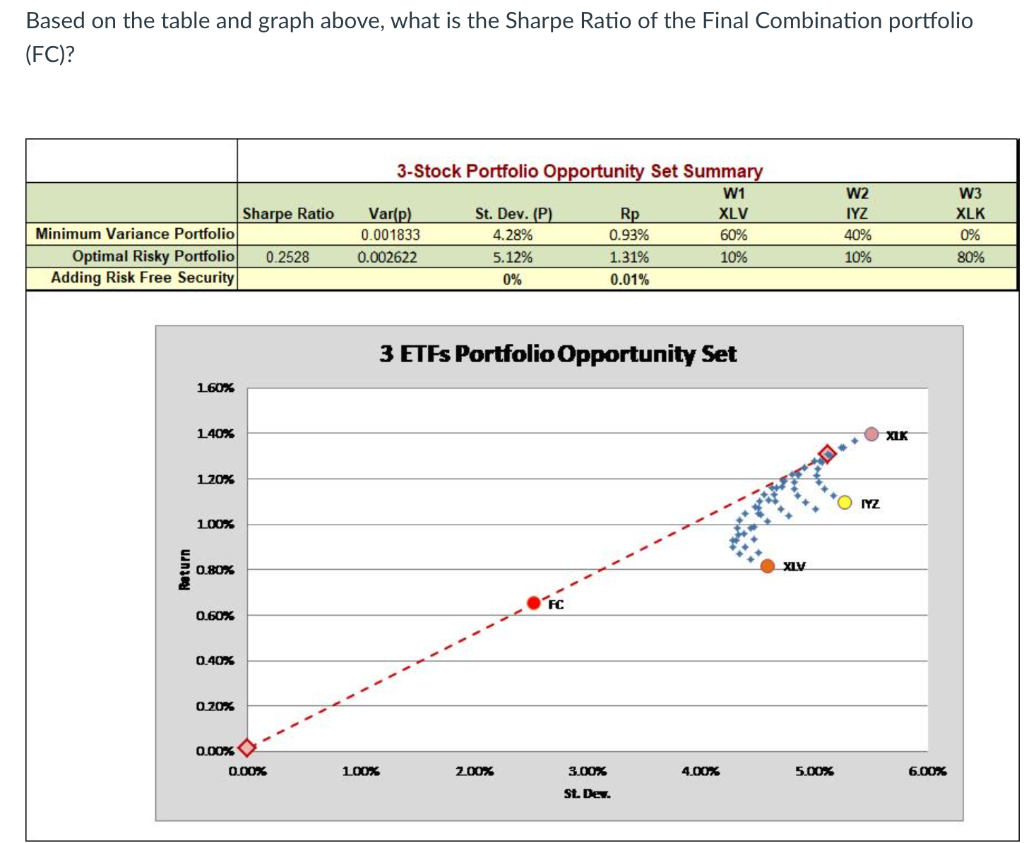
Based on the table and graph above, what is the Sharpe Ratio of the Final Combination portfolio (FC)? 3-Stock Portfolio Opportunity Set Summary W1 Var(p) St. Dev. (P) Rp XLV 0.001833 4.28% 0.93% 60% 0.002622 5.12% 1.31% 10% 0% 0.01% Sharpe Ratio Minimum Variance Portfolio Optimal Risky Portfolio 0.2528 Adding Risk Free Security W2 IYZ 40% 10% W3 XLK 0% 80% 3 ETFs Portfolio Opportunity Set 160% 140% XIK 1 20% IYZ 100% 0.80% Return XLV 0.60% 0.40% 0.20% 0.00% 0.00% 100% 200% 3.00% 4.00% 5.00% 6.00% st. Dey
Step by Step Solution
There are 3 Steps involved in it
1 Expert Approved Answer
Step: 1 Unlock

Question Has Been Solved by an Expert!
Get step-by-step solutions from verified subject matter experts
Step: 2 Unlock
Step: 3 Unlock