

Question: Based on the two tables and the graph above, if your client decides to split their money 50/50 between Rf security and ORP, what would
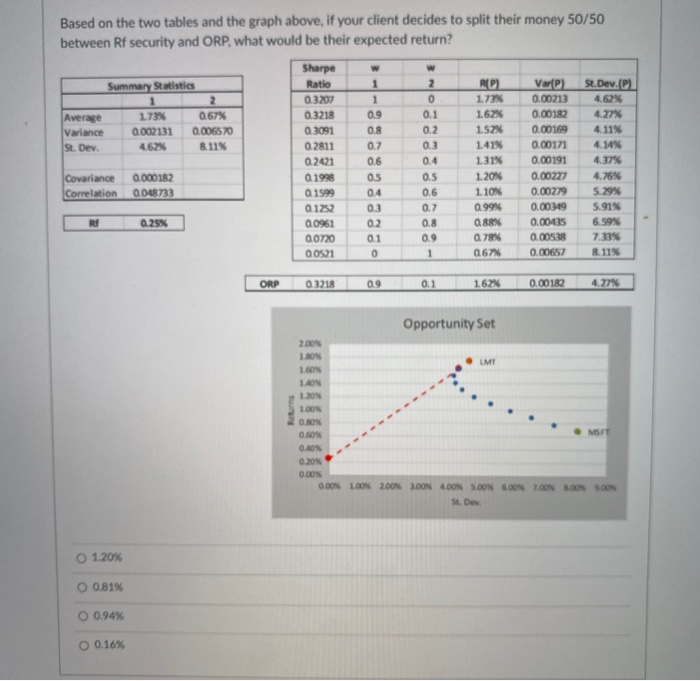
Based on the two tables and the graph above, if your client decides to split their money 50/50 between Rf security and ORP, what would be their expected return? Sharpe Summary Statistics Ratio 1 2 RO Vare St.Dev. 1 2 0.3207 1 1.73% 0.00213 4.62% Average 1.73% 0.67% 0.3218 0.9 0.1 1.62% 0.00182 4.27% Variance 0.002131 0.006570 0.3091 08 0.2 1.52% 0.00169 4.11% St. Dev. 462% 811% 0.2811 0.7 0.3 1413 0.00171 4.14% 0.2421 0.6 0.4 1.31% 0.00191 4.37% Covariance 0.000182 a 1998 05 0.5 120% 0.00227 4.76% Correlation 0.048733 0 1599 0.4 0.6 1.10% 0.00279 5.29% 0.1252 0.7 a 99% 0.00349 5.91% RI 0.25% 00961 02 0.8 88 0.00435 6.59% 2.0720 0.1 0.9 a 78% 0.00538 7.333 00521 0 1 067 0.00657 8.11% ORP 03218 0.9 0.1 1.62% 0.00182 4.27% Opportunity Set UMT 2.00 1.SON 1 BON 140N 1. Returns 0.80N 0.60% MISHT 0.40 0.20 0.00% G.BON LOON 200N BOON 4.00N 5.00 6.00 7.00 RONSON se. Dev. O 1.20% O 0.81% O 0.94% O 0.16%
Step by Step Solution
There are 3 Steps involved in it

Get step-by-step solutions from verified subject matter experts