

Question: Based on the two tables and the graph above, what would be the Sharpe Ratio of the 50/50 Final Combination of Rf security and ORP?
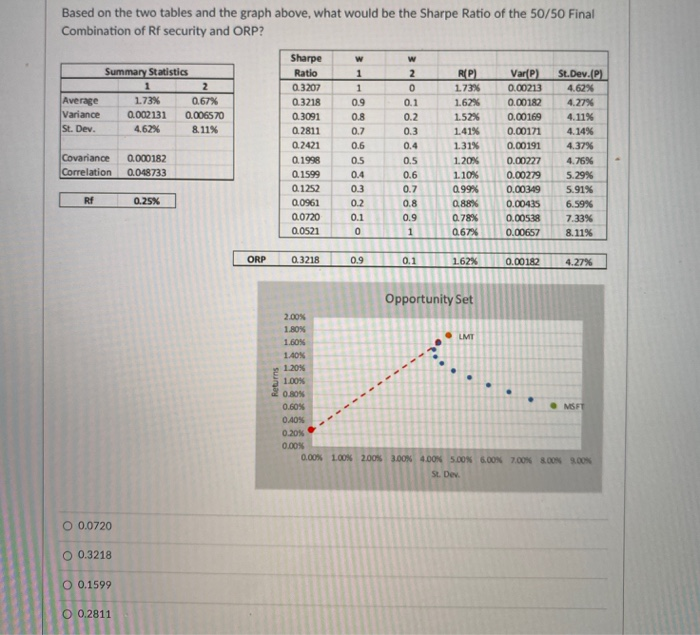
Based on the two tables and the graph above, what would be the Sharpe Ratio of the 50/50 Final Combination of Rf security and ORP? W Summary Statistics 1 2 1.73% 0.67% 0.002131 0.006570 4.62% 8.11% 2 0 0.1 Average Variance St. Dev. 0.2 Sharpe Ratio 0.3207 0.3218 0.3091 0.2811 0.2421 0 1998 0.1599 0.1252 0.0961 0.0720 0.0521 W 1 1 0.9 0.8 0.7 0.6 0.5 0.4 03 0.2 0.1 0 Rel 173% 1.62% 1.52% 1.41% 1.31% 1.20% 1.10% 0.99% 0.88% 0.78% 0.67% Var) 0.00213 0.00182 0.00169 0.00171 0.00191 0.00227 0.00279 0.00349 0.00435 0.00538 0.00657 0.3 0.4 0.5 0.6 0.7 0.8 0.9 1 St.Dev.ce1 4.62% 4.27% 4.11% 4.14% 4.37% 4.76% 5.29% 5.91% 6.59% 7.33% 8.11% Covariance Correlation 0.000182 0.048733 RE 0.25% ORP 0.3218 0.9 0.1 1.62% 0.00182 4.27% Opportunity Set Returns 2.00% 1.80% LMT 1.60% 1.40% 1.20% 1.00% 0.80% . MIST 0.40% 0.20% 0.00% 0.00% 100% 2.00% 3.00% 4.00% 5.00% 6.00% 2.00% 2.00% 2.00% SL Dev 0.60% O 0.0720 O 0.3218 O 0.1599 O 0.2811
Step by Step Solution
There are 3 Steps involved in it

Get step-by-step solutions from verified subject matter experts