

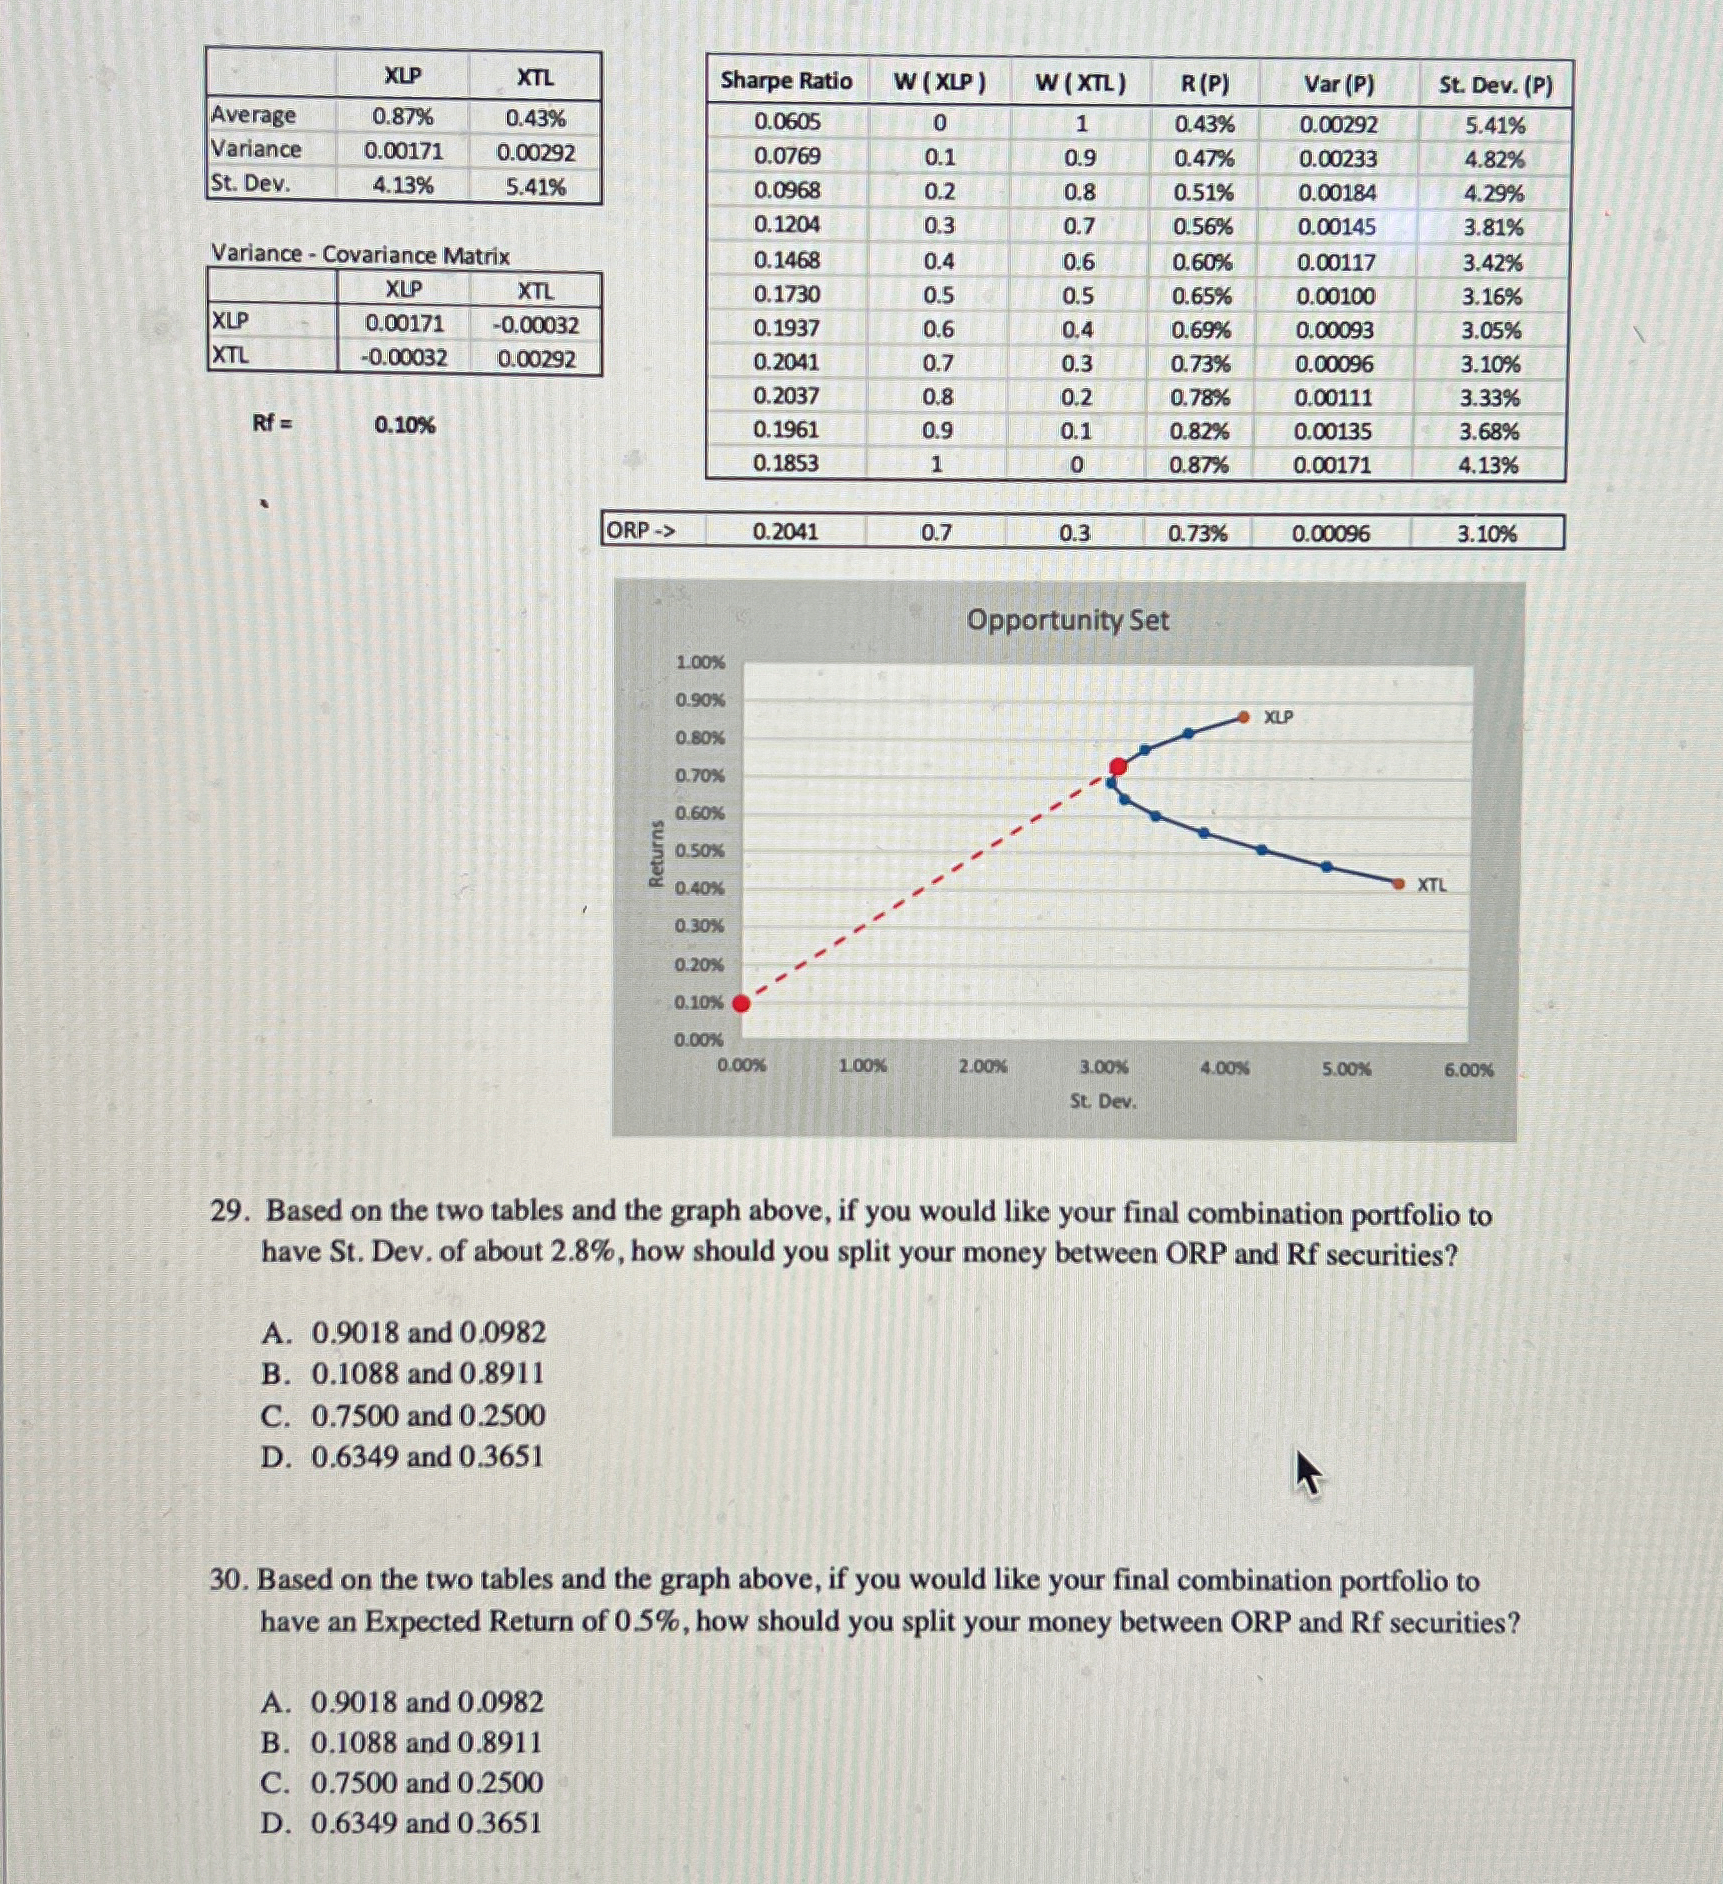
Question: Variance - Covariance Matrix Based on the two tables and the graph above, if you would like your final combination portfolio to have St .
Variance Covariance Matrix
Based on the two tables and the graph above, if you would like your final combination portfolio to
have St Dev. of about how should you split your money between ORP and Rf securities
A and
B and
C and
D and
Based on the two tables and the graph above, if you would like your final combination portfolio to
have an Expected Return of how should you split your money between ORP and Rf securities
A and
B and
C and
D and
Step by Step Solution
There are 3 Steps involved in it
1 Expert Approved Answer
Step: 1 Unlock

Question Has Been Solved by an Expert!
Get step-by-step solutions from verified subject matter experts
Step: 2 Unlock
Step: 3 Unlock