

Question: Based on the two tables and the graph above, if you would like your final combination portfolio to have an Expected Return of 1.2%, how
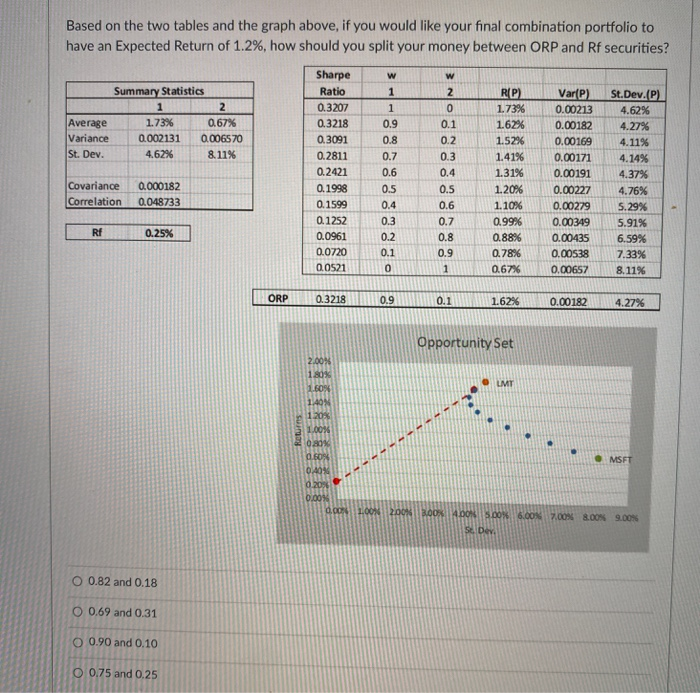
Based on the two tables and the graph above, if you would like your final combination portfolio to have an Expected Return of 1.2%, how should you split your money between ORP and Rf securities? W w Summary Statistics 1 2 Average 1.73% 0.67% Variance 0.002131 0.0065 70 St. Dev. 4.62% 8. 11% 2 0 0.1 0.2 Sharpe Ratio 0.3207 0.3218 0.3091 0.2811 0.2421 0.1998 0.1599 0.1252 0.0961 0.0720 00521 Covariance Correlation 0.000182 0.048733 1 1 0.9 0.8 0.7 0.6 0.5 0.4 0.3 0.2 0.1 0 0.3 0.4 0.5 0.6 0.7 0.8 0.9 RP) 1.73% 1.62% 1.5296 1.41% 1.31% 1.20% 1.10% 0.99% 0.88% 0.78% 0.67%6 Var(P) 0.00213 0.00182 0.00169 0.00171 0.00191 0.00227 0.00279 0.00349 0.00435 0.00538 0.00657 St.Dev.(P) 4.62% 4.27% 4.11% 4.14% 4.37% 4.76% 5.29% 5.91% 6.59% 7.33% 8.11% Rf 0.25% 1 ORP 0.3218 0.9 0.1 1.62% 0.00182 4.27% Returns Opportunity Set 2.00% 180% 1.60% O LMT 1.40 1.20% 1.00% 0.80% 0.60% . MSFT 0 AM 0 20% 0.00% .LOON 2003.00 14.00 5.00% 6.00 7.00 8.00 9.00% 5 Devi O 0.82 and 0.18 O 0.69 and 0.31 O 0.90 and 0.10 O 0.75 and 0.25
Step by Step Solution
There are 3 Steps involved in it

Get step-by-step solutions from verified subject matter experts