

Question: Below is a figure summarizing some data for which a simple linear regression analysis has been performed. The point denoted X that appears on the
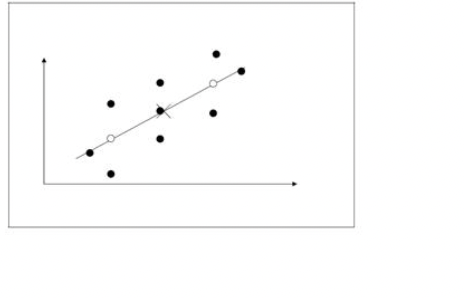
Below is a figure summarizing some data for which a simple linear regression analysis has been performed. The point denoted X that appears on the line is (x,y). The two points indicated by open circles were NOT included in the original analysis. Suppose the two points represented by the open circles are added to the data set and the regression analysis is repeated. What is the effect of adding these points on the estimated slope:
\f
Step by Step Solution
There are 3 Steps involved in it
1 Expert Approved Answer
Step: 1 Unlock

Question Has Been Solved by an Expert!
Get step-by-step solutions from verified subject matter experts
Step: 2 Unlock
Step: 3 Unlock