

Question: Below is a table of data collected over a six-month period in a local grocery store. Construct a Pareto analysis of the data and determine
Below is a table of data collected over a six-month period in a local grocery store. Construct a Pareto analysis of the data and determine the percentage of total complaints represented by the TWO most common categories. (Create the Pareto Chart)
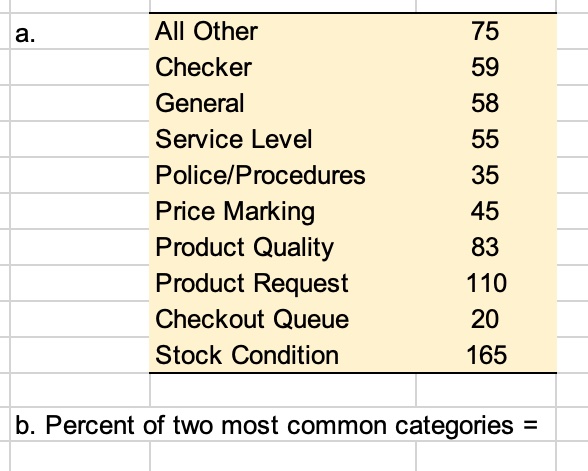
a. All Other 75 Checker 59 General 58 Service Level 55 Police/Procedures 35 Price Marking 45 Product Quality 83 Product Request 110 Checkout Queue 20 Stock Condition 165 b. Percent of two most common categories =
Step by Step Solution
There are 3 Steps involved in it
1 Expert Approved Answer
Step: 1 Unlock

Question Has Been Solved by an Expert!
Get step-by-step solutions from verified subject matter experts
Step: 2 Unlock
Step: 3 Unlock