

Question: Capstone Round 4 Decisions please help. Any advice/ recommendation on what should I do for R&D,Marketing, Finance, Production 1.) Marketing 2.) Research and Development 3.)
Capstone Round 4 Decisions please help. Any advice/ recommendation on what should I do for R&D,Marketing, Finance, Production
1.) Marketing
2.) Research and Development
3.)
4.) Finance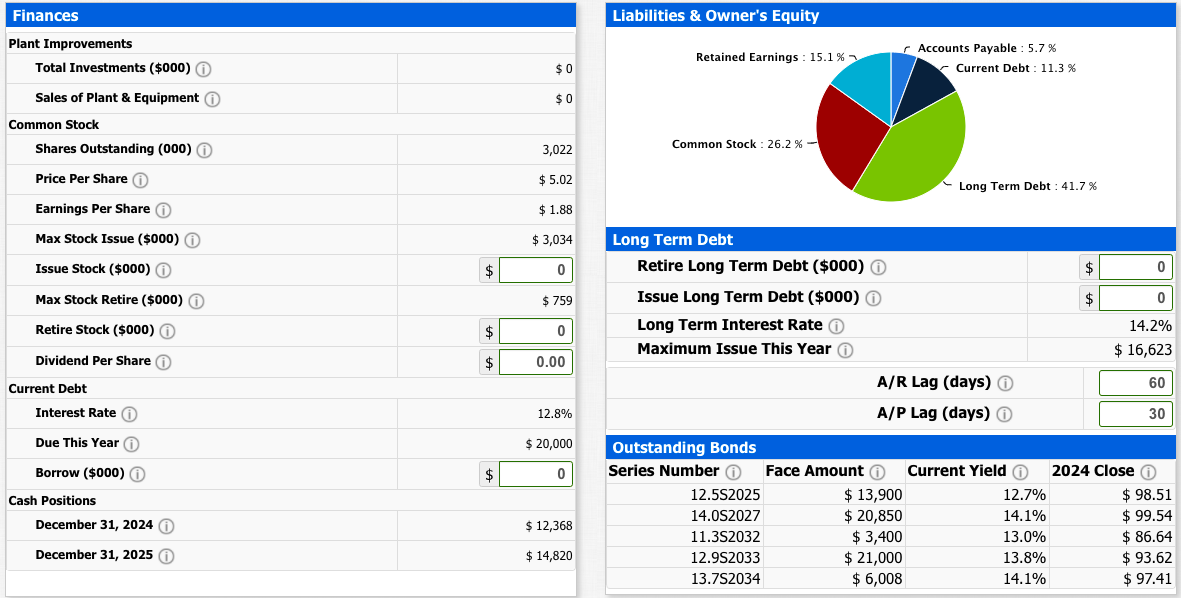
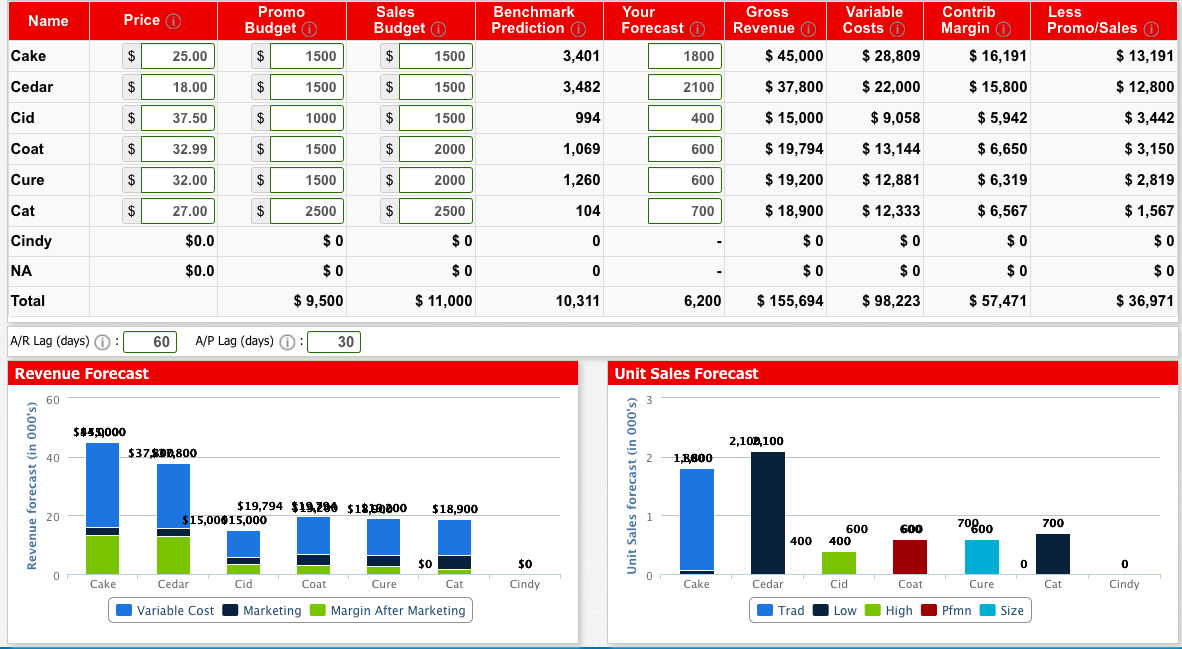
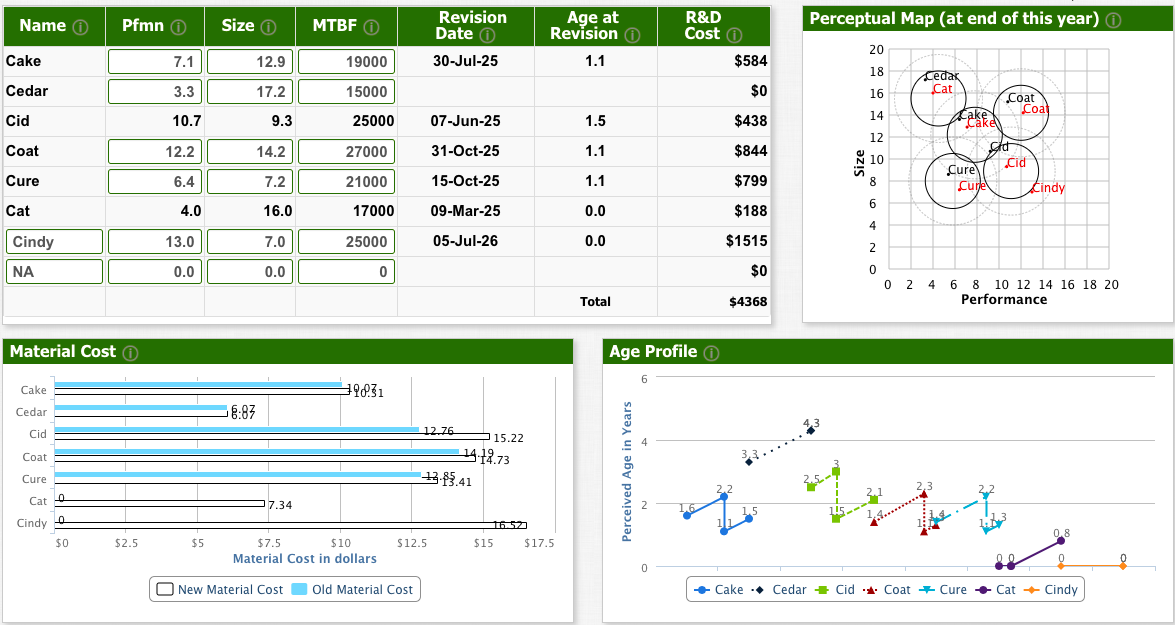
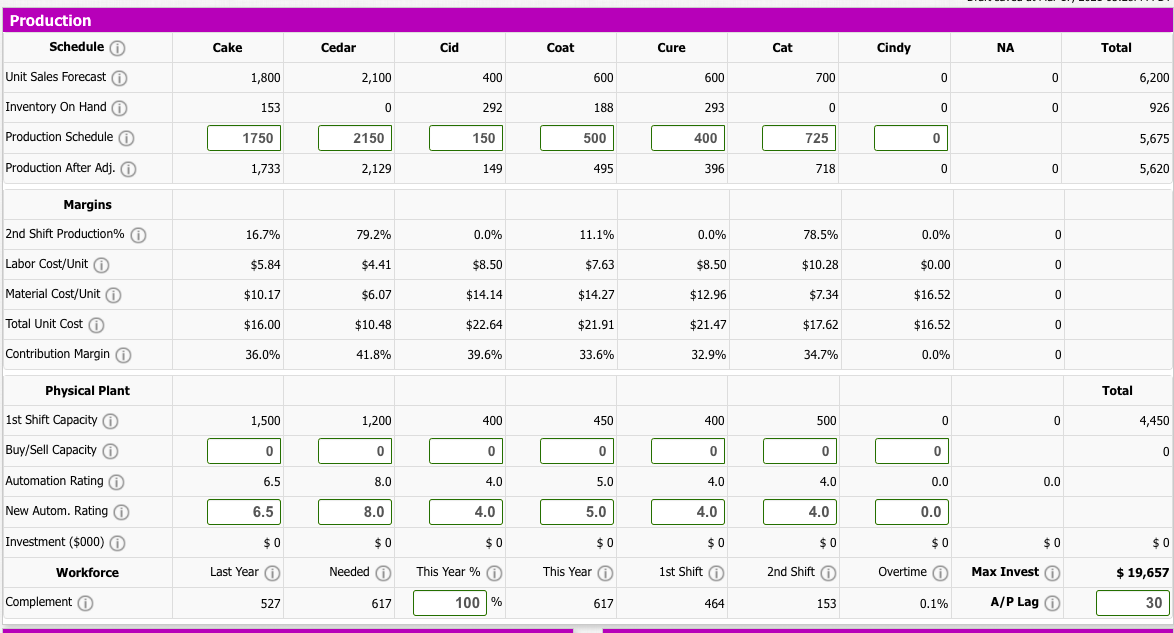
Promo Name Price 0 Sales Budget Your Forecast Benchmark Prediction 3,401 Gross Revenue Variable Costs Budget Less Promo/Sales Contrib Margin $ 16,191 Cake $ 25.00 1500 1500 1800 $ 45,000 $ 28,809 $ 13,191 Cedar $ 18.00 $ 1500 $ 1500 3,482 2100 $ 37,800 $ 22,000 $ 15,800 $ 12,800 Cid $ 37.50 $ 1000 $ 1500 994 400 $ 15,000 $ 9,058 $ 5,942 $ 3,442 Coat $ 32.99 $ 1500 $ 2000 1,069 600 $ 19,794 $ 13,144 $ 6,650 $ 3,150 Cure $ 32.00 $ 1500 $ 2000 1,260 600 $ 19,200 $ 12,881 $ 6,319 $ 2,819 Cat $ 27.00 $ 2500 $ 2500 104 700 $ 12,333 $ 6,567 $ 1,567 $ 18,900 $0 Cindy $0.0 $0 $0 $ 0 $ 0 $ 0 NA $0.0 $ 0 $0 0 $0 $0 $0 $0 Total $ 9,500 $ 11,000 10,311 6,200 $ 155,694 $ 98,223 $ 57,471 $ 36,971 A/R Lag (days) : 60 A/P Lag (days) : 30 Revenue Forecast Unit Sales Forecast 60 $#499000 $37.900,800 2,100,100 40 1,8,800 Revenue forecast (in 000's) Ik Unit Sales forecast (in 000's) $19,794 $19,266 $18.99000 $15,000 15,000 $18,900 700 600 70800 600 400 400 $0 0 0 $0 Cindy 0 Cake Cedar Cid Coat Cure Cat Cake Cedar Cid Coat Cure Cat Cindy Variable Cost Marketing Margin After Marketing Trad Low High Pfmn Size Name o Pfmn Size MTBF Revision Date 30-Jul-25 Age at Revision Perceptual Map (at end of this year) O R&D Cost o $584 20 Cake 7.1 12.9 19000 1.1 18 Cedar Cedar Cat 3.3 17.2 15000 $0 16 Coat Coal Cid 10.7 9.3 25000 07-Jun-25 1.5 $438 14 12 Coat 12.2 14.2 27000 31-Oct-25 1.1 $844 Size 10 Cure gla cid Cup Cindy Cure 6.4 7.2 21000 15-Oct-25 1.1 $799 8 6 Cat 4.0 16.0 17000 09-Mar-25 0.0 $188 4 Cindy 13.0 7.0 25000 05-Jul-26 0.0 $1515 2 NA 0.0 0.0 0 $0 0 02 4 6 8 10 12 14 16 18 20 Performance Total $4368 Material Cost o Age Profile Cake 90.31 Cedar 16:83 Cid 12.76 15.22 Coat Cure 1418.73 13-5.41 Perceived Age in Years Cat 0 7.34 Cindy 16.52 $0 $2.5 $5 $12.5 $15 $17.5 $7.5 $10 Material Cost in dollars 0 O New Material Cost Old Material Cost + Cake Cedar + Cid - Coat + Cure + Cat + Cindy Production Schedule Cake Cedar Cid Coat Cure Cat Cindy NA Total Unit Sales Forecast 1,800 2,100 400 600 600 700 0 0 6,200 153 0 292 188 293 0 0 0 926 Inventory On Hand Production Schedule 1750 2150 150 500 400 725 0 0 5,675 Production After Adj. 1,733 2,129 149 495 396 718 0 0 5,620 Margins 16.7% 79.2% 0.0% 11.1% 0.0% 78.5% 0.0% 0 2nd Shift Production% 0 Labor Cost/Unit $5.84 $4.41 $8.50 $7.63 $8.50 $10.28 $0.00 0 Material Cost/Unit $10.17 $6.07 $14.14 $14.27 $12.96 $7.34 $16.52 0 Total Unit Cost O $16.00 $10.48 $22.64 $21.91 $21.47 $17.62 $16.52 0 Contribution Margin 36.0% 41.8% 39.6% 33.6% 32.9% 34.7% 0.0% 0 Physical Plant Total 1st Shift Capacity 1,500 1,200 400 450 400 500 0 0 4,450 Buy/Sell Capacity 0 0 0 0 0 0 0 0 Automation Rating 1.0. 6.5 8.0 4.0 5.0 4.0 4.0 0.0 0.0 1.5... New Autom. Rating 6.5 8.0 4.0 5.0 4.0 4.0 1993 0.0 Investment ($000) O $ 0 $0 $0 $ 0 $ 0 $ 0 $ 0 $ 0 $0 Workforce Last Year Needed This Year % 0 This Year 1st Shift 2nd Shift Overtime Max Invest $ 19,657 Complement 527 617 100 % 617 464 153 0.1% A/P Lag 30 Finances Liabilities & Owner's Equity Plant Improvements Total Investments ($000) Retained Earnings : 15.1% Accounts Payable : 5.7% Current Debt: 11.3% $ 0 Sales of Plant & Equipment $ 0 Common Stock 3,022 Shares Outstanding (000) Common Stock: 26.2 % - Price Per Share $ 5.02 Long Term Debt: 41.7 % $ 1.88 Earnings Per Share o Max Stock Issue ($000) O Issue Stock ($000) $ 3,034 $ 0 $ 0 Max Stock Retire ($000) $ 759 Long Term Debt Retire Long Term Debt ($000) O Issue Long Term Debt ($000) O Long Term Interest Rate Maximum Issue This Year $ 0 Retire Stock ($000) O $ 0 14.2% $ 16,623 Dividend Per Share $ 0.00 Current Debt A/R Lag (days) 60 Interest Rate 12.8% A/P Lag (days) 30 Due This Year $ 20,000 Borrow ($000) $ 0 Cash Positions Outstanding Bonds Series Number Face Amount Current Yield 2024 Close 12.592025 $ 13,900 12.7% $ 98.51 14.0S2027 $ 20,850 14.1% $ 99.54 11.352032 $ 3,400 13.0% $ 86.64 12.9S2033 $ 21,000 13.8% $ 93.62 13.752034 $ 6,008 14.1% $ 97.41 December 31, 2024 $ 12,368 December 31, 2025 $ 14,820
Step by Step Solution
There are 3 Steps involved in it
1 Expert Approved Answer
Step: 1 Unlock

Question Has Been Solved by an Expert!
Get step-by-step solutions from verified subject matter experts
Step: 2 Unlock
Step: 3 Unlock