

Question: ch. 6s - 19 is the process in control? Refer to the table Factors for Computing Control Chart Limits (3 sigma) for this problem. A
ch. 6s - 19
is the process in control?
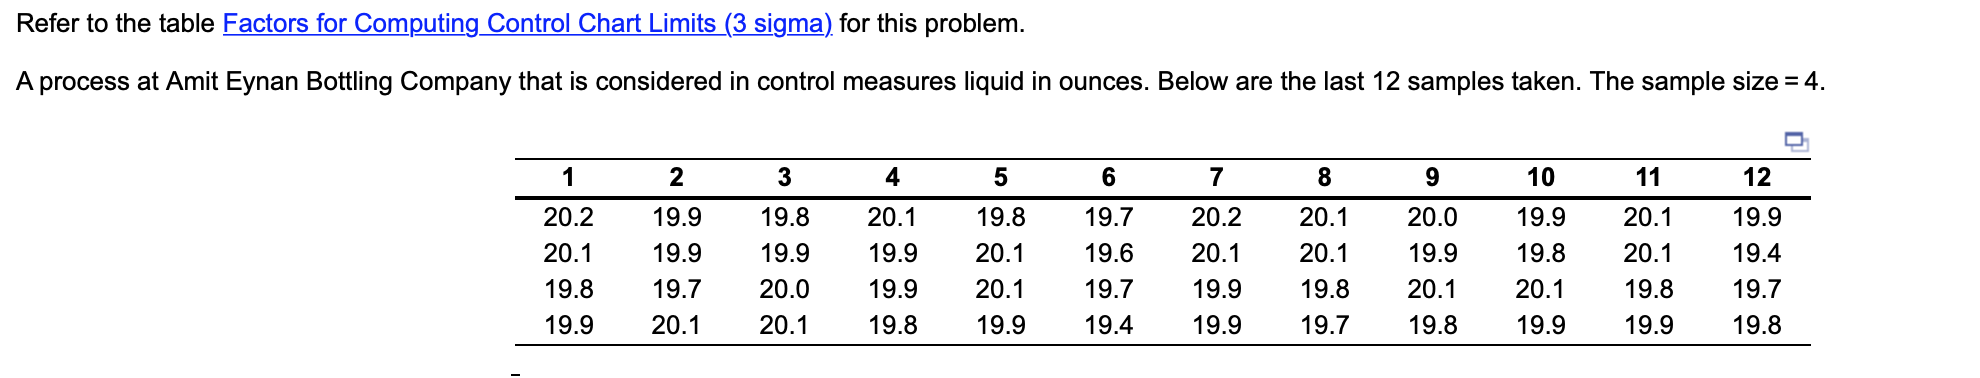
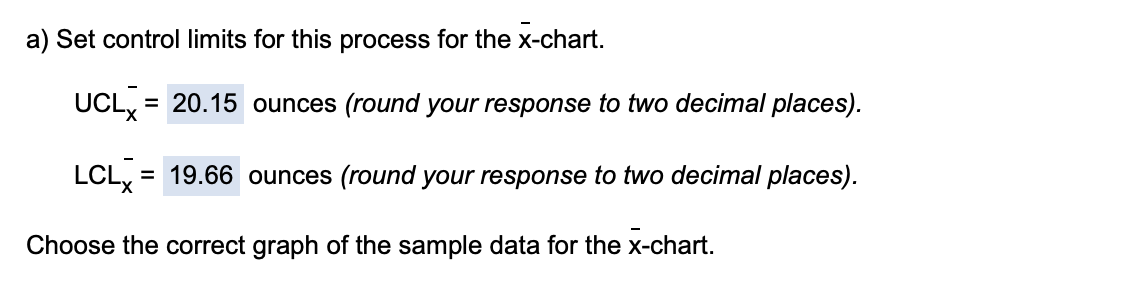
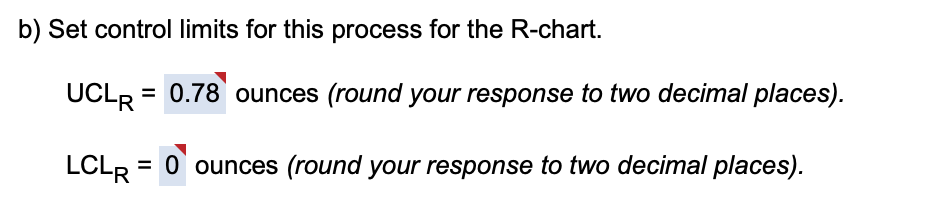
Refer to the table Factors for Computing Control Chart Limits (3 sigma) for this problem. A process at Amit Eynan Bottling Company that is considered in control measures liquid in ounces. Below are the last 12 samples taken. The sample size = 4. 2 3 4 5 6 7 9 10 11 12 1 20.2 20.1 19.8 19.9 19.9 19.9 19.7 20.1 19.8 19.9 20.0 20.1 20.1 19.9 19.9 19.8 19.8 20.1 20.1 19.9 19.7 19.6 19.7 19.4 20.2 20.1 19.9 19.9 8 20.1 20.1 19.8 19.7 20.0 19.9 20.1 19.8 19.9 19.8 20.1 19.9 20.1 20.1 19.8 19.9 19.9 19.4 19.7 19.8 a) Set control limits for this process for the x-chart. = 20.15 ounces (round your response to two decimal places). UCLX LCLX = 19.66 ounces (round your response to two decimal places). Choose the correct graph of the sample data for the x-chart. b) Set control limits for this process for the R-chart. UCLR = 0.78 ounces (round your response to two decimal places). LCLR = 0 ounces (round your response to two decimal places)Step by Step Solution
There are 3 Steps involved in it
1 Expert Approved Answer
Step: 1 Unlock

Question Has Been Solved by an Expert!
Get step-by-step solutions from verified subject matter experts
Step: 2 Unlock
Step: 3 Unlock