

Question: Code in java. DESCRIPTION Design and implement a program that creates a stogram that allows you to visual inspect the frequency distribution of a set
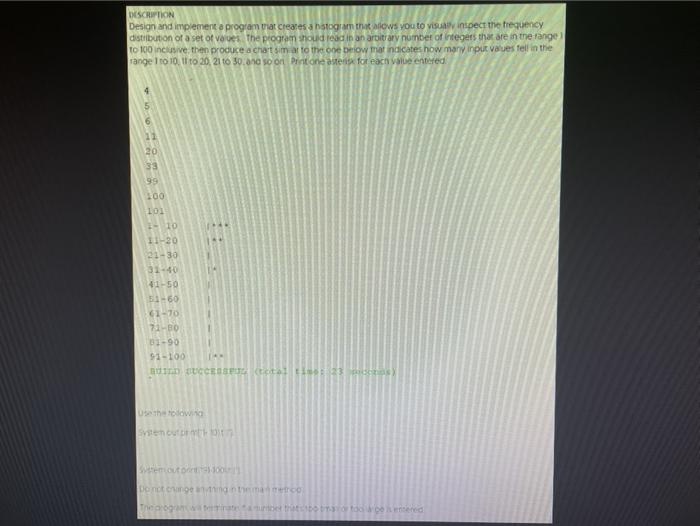
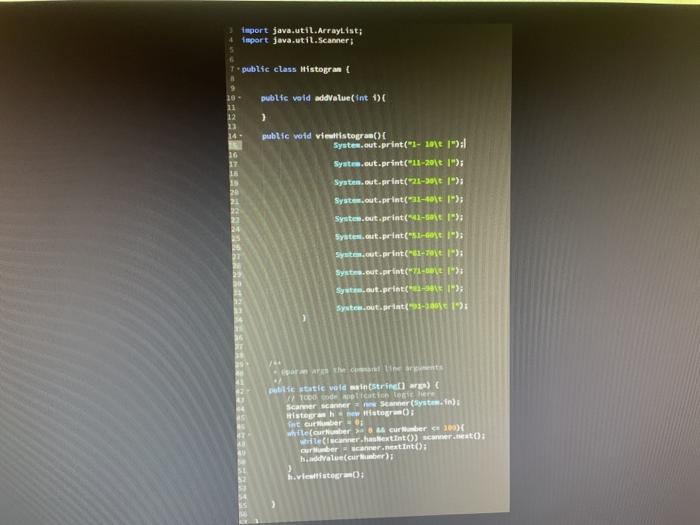
DESCRIPTION Design and implement a program that creates a stogram that allows you to visual inspect the frequency distribution of a set of over the program should lead in an artitary number of integers that are in the range to 100 inclusive the produce a chart sim ar to the one below That indicates how many input values fell in the range 1 to 10 to 20, 2110 30.010 so on Print one asterix for each value entered 20 33 99 100 10 - 10 11-20 21-30 31-40 41-50 51-60 61-10 71-30 31-90 51-100 som CUCCEST 23 Uharlow auto Doncang ng tao Theo tronood word import java.util.ArrayList; import java.util.Scanner public class Histogram public void addvalue(int 1) 20 11 12 23 14: ) 16 12 20 21 22 public world view istogram System.out.print("- 101 1"); System.out.print("11-2017 1"); System.out.print(21-2011) System.out.print(91- 1"); System.out.print(" "); System.out.print("1 1"); System.out.print("81-701"); System.out.print("71- 1) System.out.print(1-1) System.out.print(1001 politic static void main(string) 1000 Aplication here Scanner cater Scanner(System.in) Histogramew Histogros Tnt cather = while(our Huber 6.4 cuber Tehasextint()) scartato: Gruber Scanner.nextInt(): healue(car e) viewttister
Step by Step Solution
There are 3 Steps involved in it

Get step-by-step solutions from verified subject matter experts