

Question: Comparative income statement data for Ivanhoe Inc. and Bridgeport Ltd, two competitors, are shown below for the year ended December 31, 2021 Ivanhoe Bridgeport Net
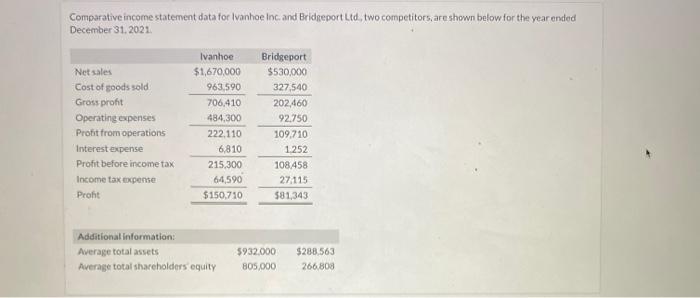
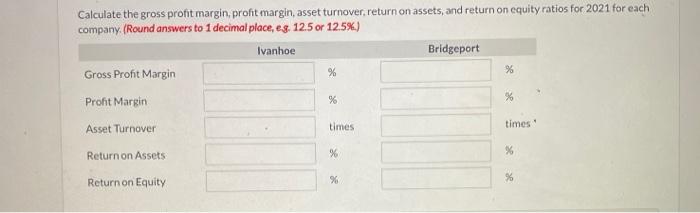
Comparative income statement data for Ivanhoe Inc. and Bridgeport Ltd, two competitors, are shown below for the year ended December 31, 2021 Ivanhoe Bridgeport Net sales $1,670,000 $530,000 Cost of goods sold 963,590 327,540 Gross profit 706,410 202,460 Operating expenses 484.300 92.750 Profit from operations 222.110 109.710 Interest expense 6,810 1.252 Profit before income tax 215,300 108.458 Income tax expense 64,590 27.115 Proht $150.710 $81,343 Additional Information: Average total assets Average total shareholders equity $932,000 805,000 $288.563 266808 Calculate the gross profit margin, profit margin, asset turnover return on assets, and return on equity ratios for 2021 for each company. (Round answers to 1 decimal place, es. 12.5 or 12.5%) Ivanhoe Bridgeport Gross Proht Margin % Profit Margin % % % Asset Turnover times times Return on Assets % % Return on Equity
Step by Step Solution
There are 3 Steps involved in it

Get step-by-step solutions from verified subject matter experts