

Question: JSF Concepts: CHM2045L Pre-lab Quiz for Project 2: CHM2045L.01351 Access link #1 and read the section about light intensity (lo and I), transmittance (T)
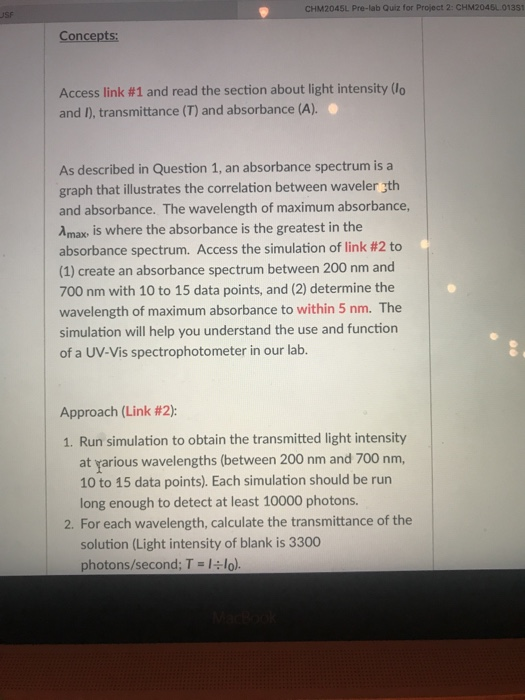
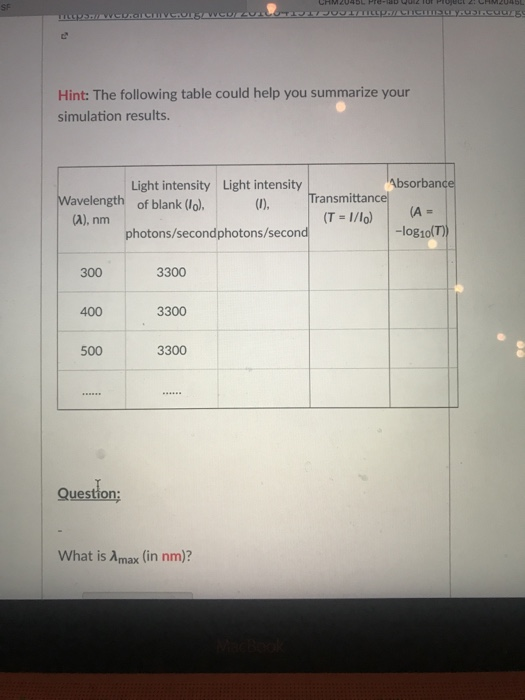
JSF Concepts: CHM2045L Pre-lab Quiz for Project 2: CHM2045L.01351 Access link #1 and read the section about light intensity (lo and I), transmittance (T) and absorbance (A). As described in Question 1, an absorbance spectrum is a graph that illustrates the correlation between waveler gth and absorbance. The wavelength of maximum absorbance, Amax, is where the absorbance is the greatest in the absorbance spectrum. Access the simulation of link #2 to (1) create an absorbance spectrum between 200 nm and 700 nm with 10 to 15 data points, and (2) determine the wavelength of maximum absorbance to within 5 nm. The simulation will help you understand the use and function of a UV-Vis spectrophotometer in our lab. Approach (Link #2): 1. Run simulation to obtain the transmitted light intensity at yarious wavelengths (between 200 nm and 700 nm, 10 to 15 data points). Each simulation should be run long enough to detect at least 10000 photons. 2. For each wavelength, calculate the transmittance of the solution (Light intensity of blank is 3300 photons/second; T = 1lo). SF Tips: WCD Hint: The following table could help you summarize your simulation results. 300 Wavelength of blank (lo). (A), nm 400 500 mive.orgA ****** Question: Light intensity Light intensity (1), photons/secondphotons/second 3300 3300 CHM2045L Pre-lab Quiz for Project 2: CHM2045L DIZUILOTAJ1709 17p:// ChemsH YAUDAuurge 3300 ****** What is Amax (in nm)? Transmittance (T = 1/10) Absorbance (A = -log10(T))
Step by Step Solution
3.38 Rating (160 Votes )
There are 3 Steps involved in it
Answer 1 The wavelength of maximum absorbance Amax is 500 nm This can be determined by examining the absorbance spectrum which is a graph that illustrates the correlation between wavelength and absorb... View full answer

Get step-by-step solutions from verified subject matter experts