

Question: Consider the data about project activities given in the table subsequently. a. Create the Gantt chart. Schedule the work in such a way that each
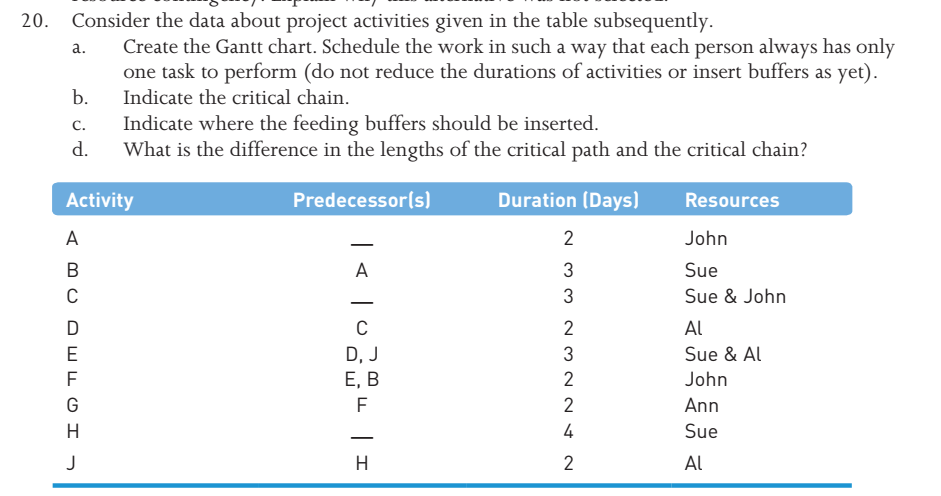
Consider the data about project activities given in the table subsequently. a. Create the Gantt chart. Schedule the work in such a way that each person always has only one task to perform (do not reduce the durations of activities or insert buffers as yet). b. Indicate the critical chain. c. Indicate where the feeding buffers should be inserted. d. What is the difference in the lengths of the critical path and the critical chain?
Nicholas, John M.; Steyn, Herman. Project Management for Engineering, Business and Technology (p. 275). Taylor and Francis. Kindle Edition.
0. Consider the data about project activities given in the table subsequently. a. Create the Gantt chart. Schedule the work in such a way that each person always has only one task to perform (do not reduce the durations of activities or insert buffers as yet). b. Indicate the critical chain. c. Indicate where the feeding buffers should be inserted. d. What is the difference in the lengths of the critical path and the critical chain
Step by Step Solution
There are 3 Steps involved in it

Get step-by-step solutions from verified subject matter experts