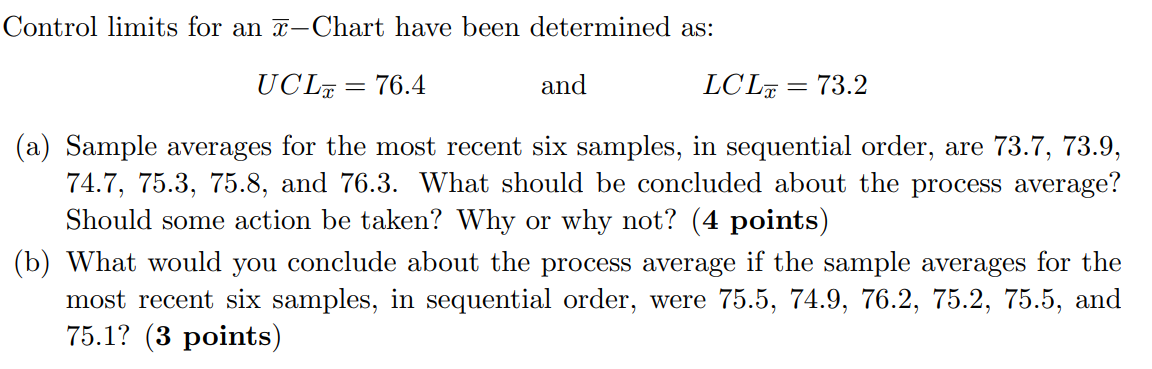
Question: Control limits for an 1-Chart have been determined as: UCL = 76.4 = and LCL = 73.2 = (a) Sample averages for the most recent

Control limits for an 1-Chart have been

Control limits for an 1-Chart have been determined as: UCL = 76.4 = and LCL = 73.2 = (a) Sample averages for the most recent six samples, in sequential order, are 73.7, 73.9, 74.7, 75.3, 75.8, and 76.3. What should be concluded about the process average? Should some action be taken? Why or why not? (4 points) (b) What would you conclude about the process average if the sample averages for the most recent six samples, in sequential order, were 75.5, 74.9, 76.2, 75.2, 75.5, and 75.1? (3 points)

Step by Step Solution

There are 3 Steps involved in it

1 Expert Approved Answer
Step: 1 Unlock blur-text-image
Question Has Been Solved by an Expert!

Get step-by-step solutions from verified subject matter experts

Step: 2 Unlock
Step: 3 Unlock

Students Have Also Explored These Related General Management Questions!