Question: could please help to solve this problem Table below presents the activities of a project. Needed Resources (man) Number Activity Duration (day) Pre-Requisite Man/day Cumulative

could please help to solve this problem could please help to solve this problem Table

Table below presents the activities of a project. Needed Resources (man) Number Activity Duration (day) Pre-Requisite Man/day Cumulative 1. A 5 1 5 2. B 6 A 1 6 3. C 7 A 1 7 4. D 7 1 7 5. E 17 A 17 6. F 5 E 5 7. G 11 E 11 8. H 5 F, B, D 1 5 1. Draw Gantt Chart and Activity on Node Diagram 2. Find out the project duration, four times (EST, EFT, LST, and LFT), critical activities and the slack (total float) for each activity. 3. Draw "Miller Curve for earliest start and latest start 4. Using try and error Resource Smoothing method: a. Draw the Daily Resources Diagram before smoothing (leveling of resources) b. Draw the Daily Resources Diagram after smoothing (leveling of resources)

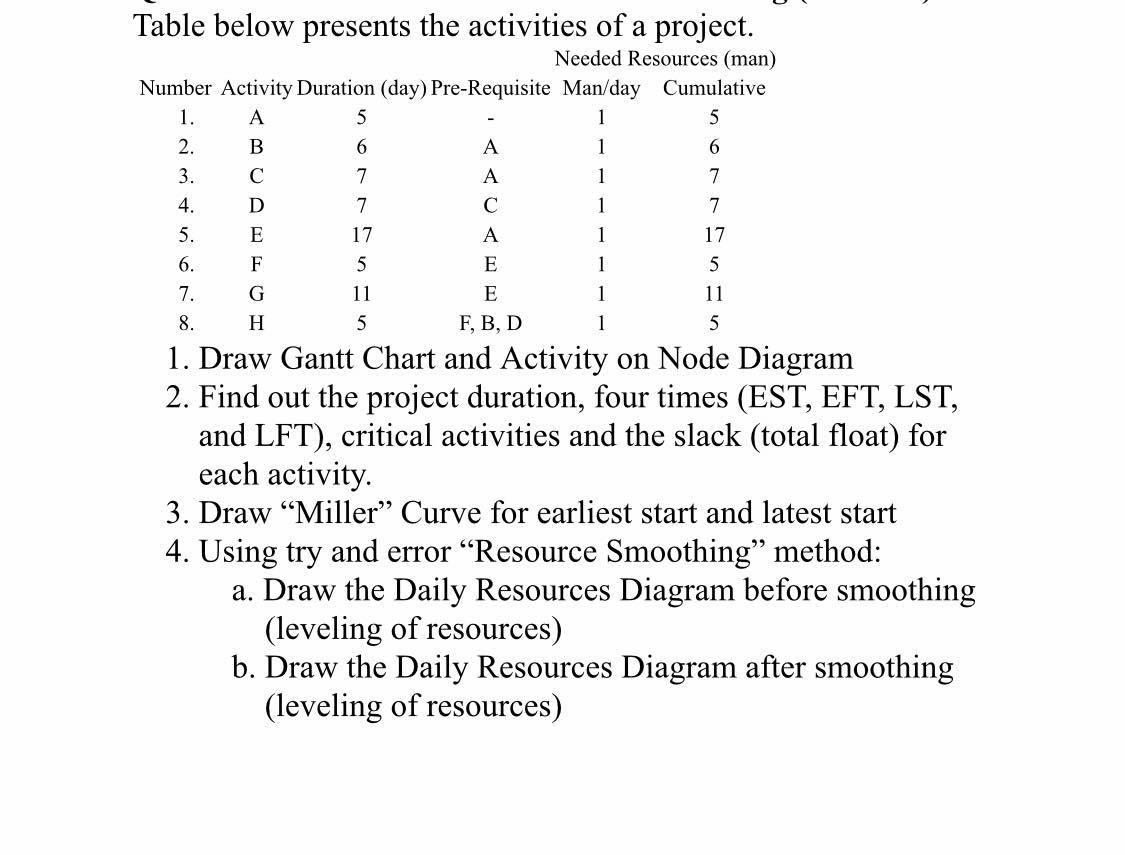
Step by Step Solution

There are 3 Steps involved in it

1 Expert Approved Answer
Step: 1 Unlock blur-text-image
Question Has Been Solved by an Expert!

Get step-by-step solutions from verified subject matter experts

Step: 2 Unlock
Step: 3 Unlock

Students Have Also Explored These Related General Management Questions!