

Question: Create a bar chart that summarizes each Salesperson's cumulative sales during the 1 2 - month period: Double click on Sheet 1 at the
Create a bar chart that summarizes each Salesperson's cumulative sales during the month period:
Double click on "Sheet at the bottom of your workbook and rename it "Total Sales by Salesperson."
On the lefthand side under "Dimensions" sometimes labeled as Tables click on "Salesperson" and drag it to the "Columns"
area above the blank sheet.
On the lefthand side under "Measures", click on "Order Amount" and drag it to the "Rows" area.
This will create a vertical bar chart.
The calculation will default to Sum which is what we need for this exercise.
Order the bar chart from highest to lowest Descending by clicking on the "Descending Sort" button in the menu bar at the
top of the screen.
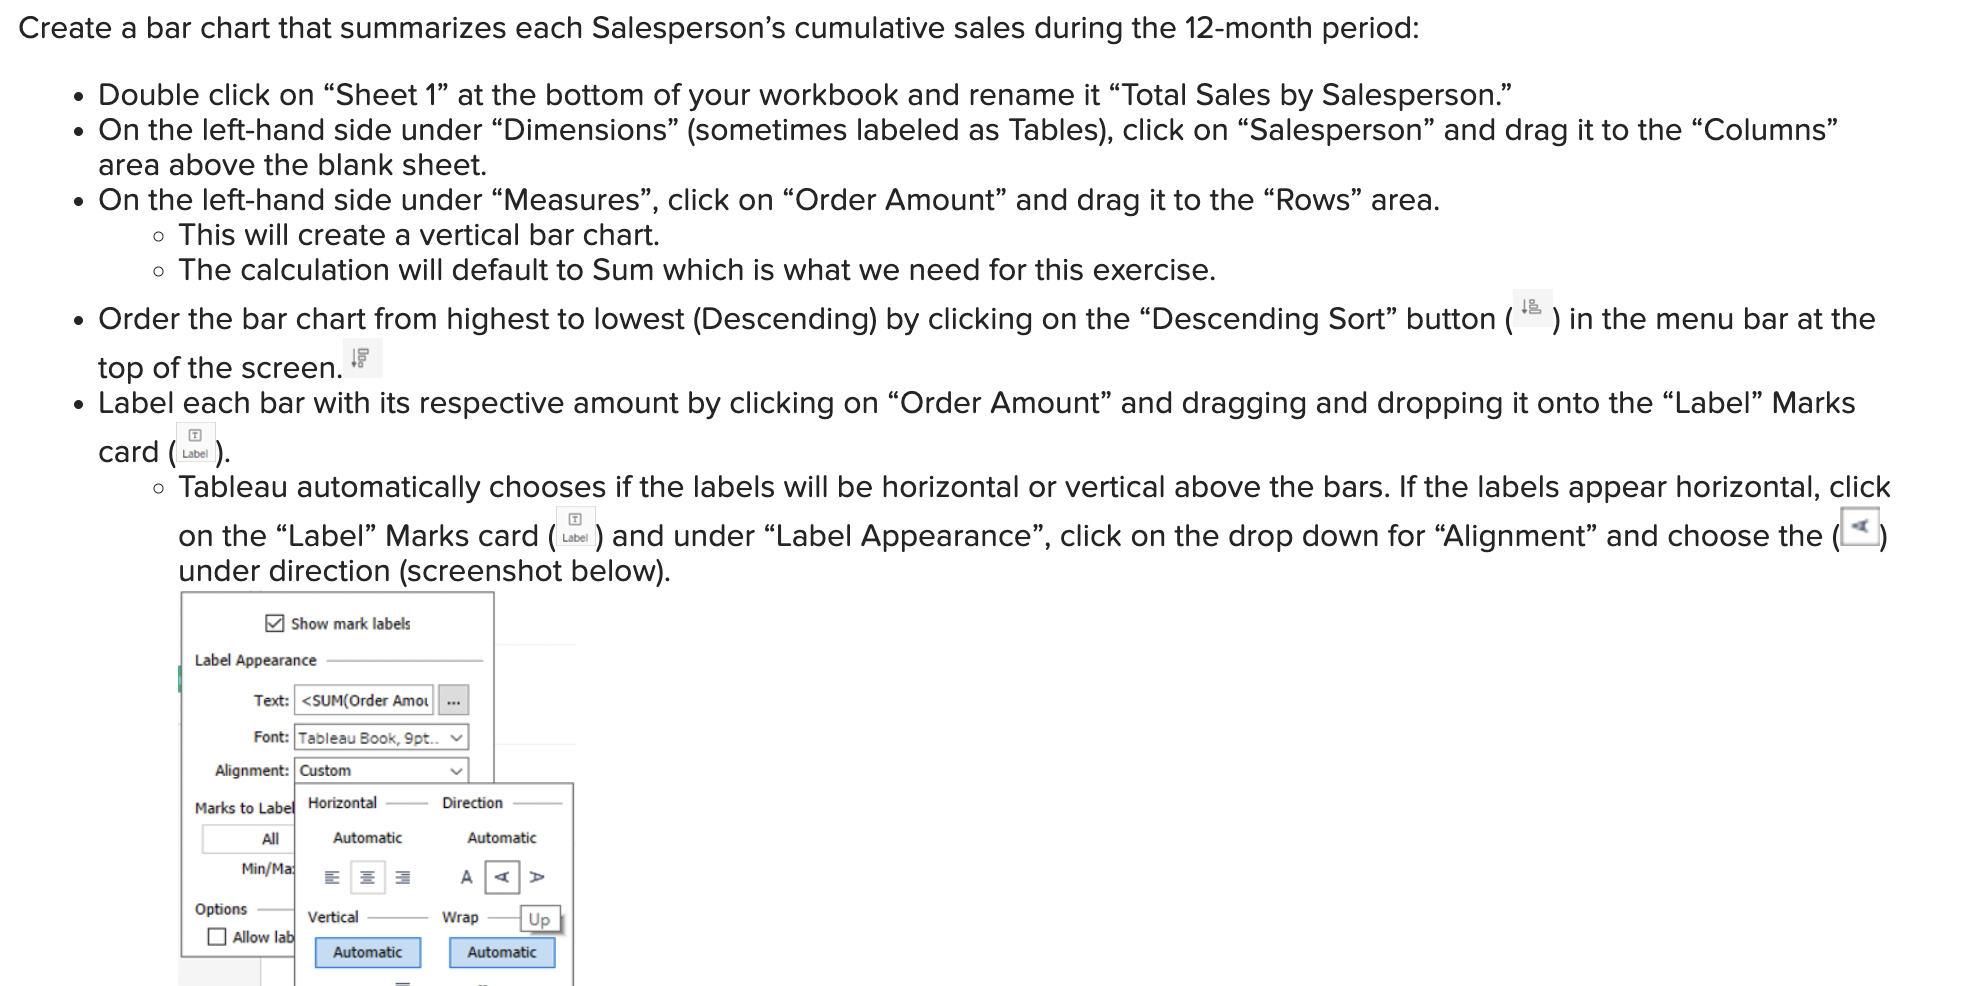
Label each bar with its respective amount by clicking on "Order Amount" and dragging and dropping it onto the "Label" Marks
tube
Step by Step Solution
There are 3 Steps involved in it
1 Expert Approved Answer
Step: 1 Unlock

Question Has Been Solved by an Expert!
Get step-by-step solutions from verified subject matter experts
Step: 2 Unlock
Step: 3 Unlock