

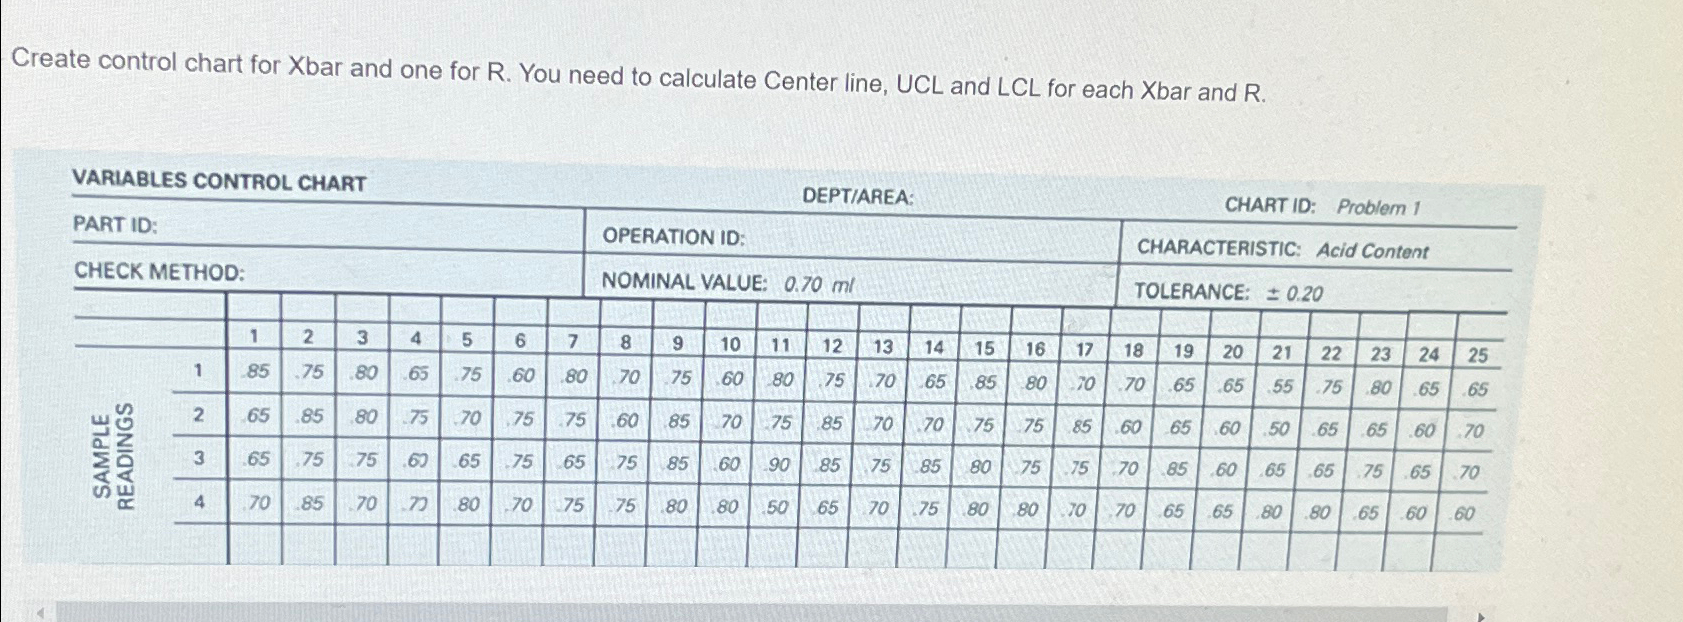
Question: Create control chart for Xbar and one for R . You need to calculate Center line, UCL and LCL for each Xbar and R .
Create control chart for Xbar and one for R You need to calculate Center line, UCL and LCL for each Xbar and R
VARIABLES CONTROL CHART
DEPTAREA:
CHART ID: Problem
Step by Step Solution
There are 3 Steps involved in it
1 Expert Approved Answer
Step: 1 Unlock

Question Has Been Solved by an Expert!
Get step-by-step solutions from verified subject matter experts
Step: 2 Unlock
Step: 3 Unlock